
Tracking U.S.- China Trade Through The Coronavirus Pandemic
The combined value of goods traded between the U.S. and China (GXC) dipped slightly below the previous month's level in November 2020.
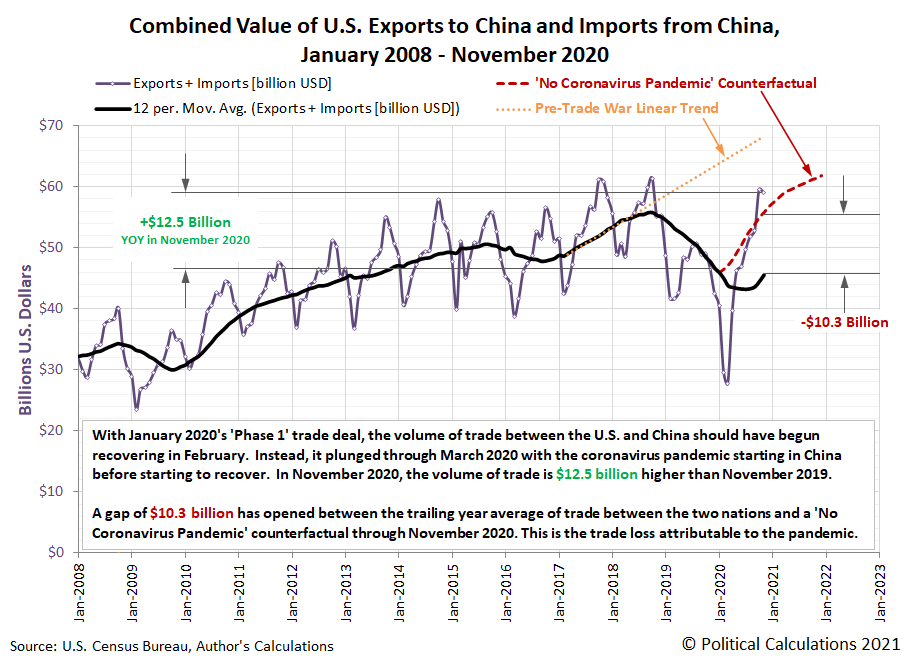
The latest update to our chart tracking the combined value of trade between the U.S. and China from January 2008 through November 2020 shows that change, and also reveals that the gap between the current trajectory of trade and a "No Coronavirus Pandemic" counterfactual has narrowed.
With January 2020's 'Phase 1' trade deal, the volume of trade between the U.S. and China should have begun recovering in February. Instead, it plunged through March 2020 with the coronavirus pandemic starting in China, before beginning to recover. In November 2020, the volume of trade between the two countries was $12.5 billion higher than in November 2019, as China continued its imports of U.S.-produced agricultural goods, led by soybeans.
Meanwhile, the gap indicating the value of trade loss attributable to the coronavirus pandemic, shown as the difference between the trailing year average of trade between the two nations and a 'No Coronavirus Pandemic' counterfactual through November 2020 in the chart, has begun to narrow. In October 2020, this figure was $10.6 billion, but has declined to $10.3 billion in November 2020.
Looking forward, with a resurgence of COVID-19 infections in much of the U.S. and also in China, we anticipate the recent upward momentum in the U.S.' imports of Chinese produced goods will fall in the months ahead. This change is a direct consequence of the new lockdown orders that several states and local jurisdictions within the U.S. are imposing on the operations of businesses, which also include the return of stay-at-home orders for residents in some in December 2020.
Balanced against that however is the year-over-year recovery in the initial loss of trade from the pandemic. We think the net change will still be positive, but will be reduced below what it would have been without the new lockdowns to negatively impact economic activity.
References
Board of Governors of the Federal Reserve System. China / U.S. Foreign Exchange Rate. G.5 Foreign Exchange Rates. Accessed 8 January 2021.
U.S. Census Bureau. Trade in Goods with China. Accessed 8 January 2021.
Disclaimer: Materials that are published by Political Calculations can provide visitors with free information and insights regarding the incentives created by the laws and policies described. ...
more

