
Top 5 Events: Q1’19 Australia Inflation Report & AUD/USD Price Forecast
04/24 WEDNESDAY | 01:30 GMT | AUD CONSUMER PRICE INDEX (1Q)
Price pressures in Australia are expected to have receded further at the start of 2019, according to a Bloomberg News survey. Despite a rebound in base metal prices and a stable Australian Dollar, more disinflation is due on the topline figure, sending it closer to the lower end of Reserve Bank of Australia’s +1-3% target range in Q1’19.
Due in at 1.5% from 1.9% (y/y), the Q1’19Australia inflation report is expected to be another signpost for the RBA that necessitates neutrality in its policy stance in the near-term and perhaps more dovish considerations by the end of the year. Even though labor markets have continued to improve in recent months, a lack of wage growth and rising indebtedness of households (already at all-time highs) makes for a concerning future for consumption trends.
(Click on image to enlarge)
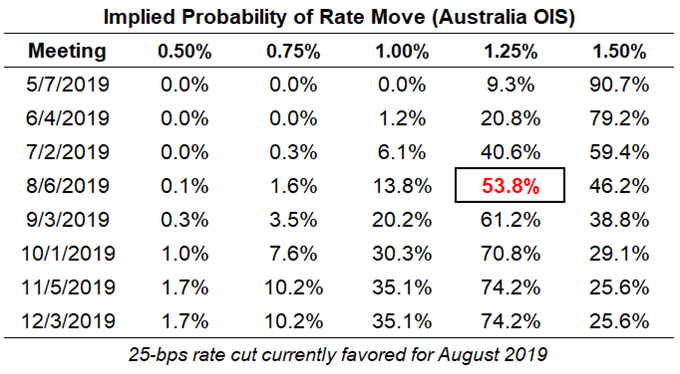
Currently, rates markets are pricing in only a 9.3% chance of a 25-bps rate cut at the May 2019 meeting. According to overnight index swaps, there is only a 20.8% chance of a 25-bps rate cut in June; but there is a 61.2% chance of a 25-bps cut by September 2019.
Pairs to Watch: AUDJPY, AUDNZD, AUDUSD
AUDUSD TECHNICAL FORECAST: DAILY PRICE CHART (JANUARY 2018 TO APRIL 2019) (CHART 1)
(Click on image to enlarge)
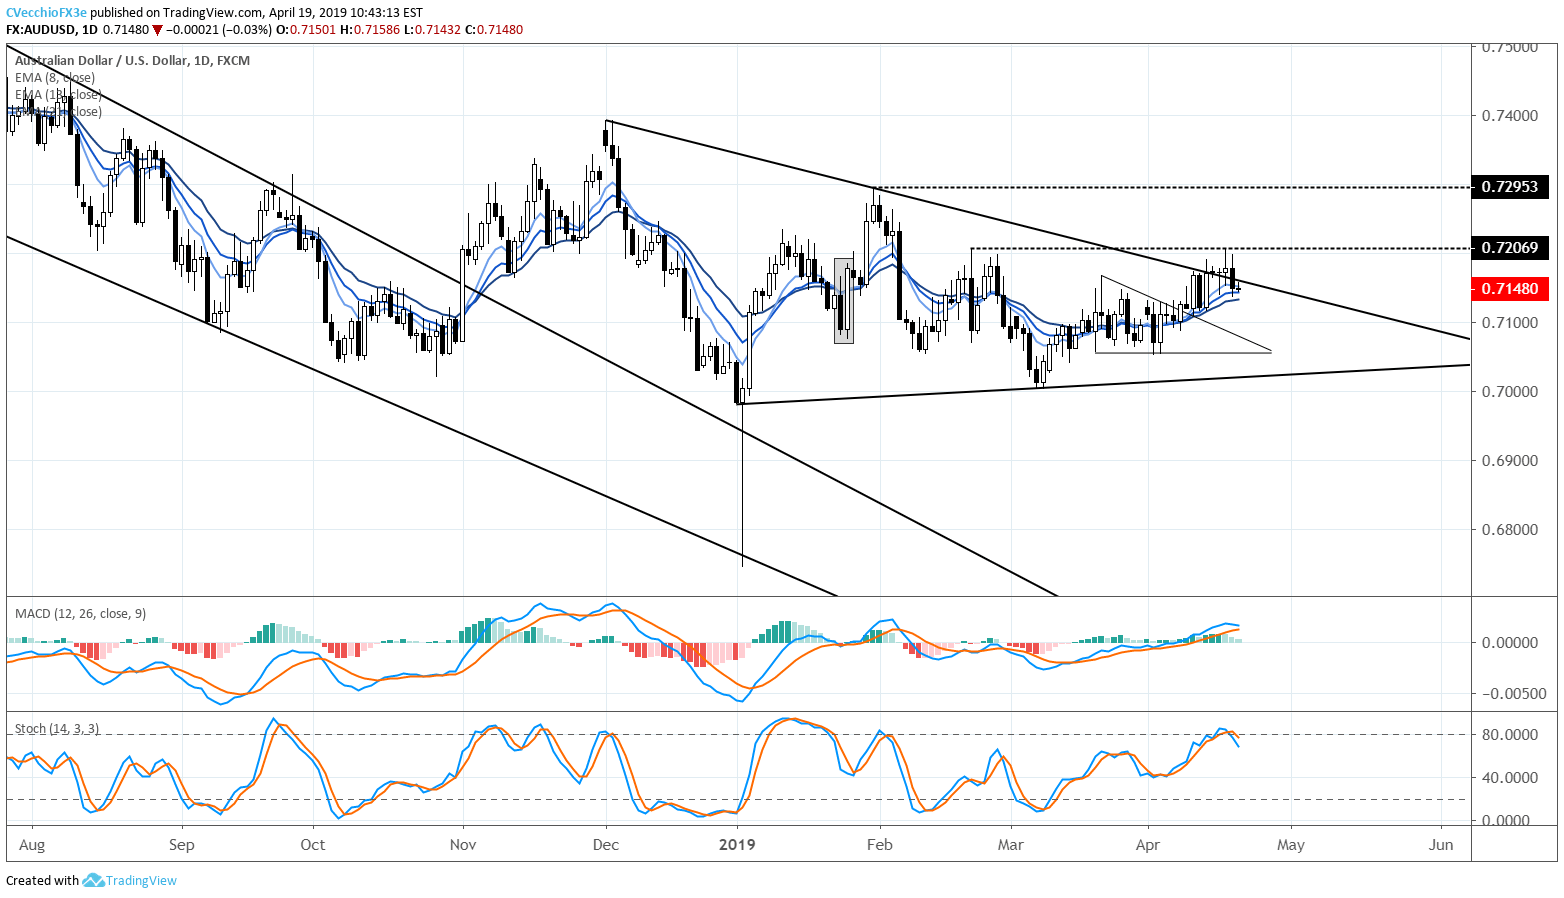
AUDUSD has been trading in a symmetrical triangle since early-December 2018, and this past week it appeared that AUDUSD price action was leading to a bullish breakout. But the breakout attempt on Tuesday and Wednesday failed, with price closing back within the triangle consolidation on Thursday; AUDUSD price was unable to clear out the February 21 bearish outside engulfing bar high at 0.7207, now going on two-months as swing resistance.
As such, the AUDUSD technical forecast has necessarily weakened in recent day. Price is once again enmeshed in the daily 8-, 13-, and 21-EMA envelope as momentum has started to turn lower. Slow Stochastics have turned to the downside out of overbought territory, while daily MACD has started to narrow and turn lower. Should price turn below the daily 21-EMA (currently 0.7133), odds would increase for a deeper setback for AUDUSD prices back towards its early-December 2018 symmetrical triangle support around 0.7025 by the end of April.
IG CLIENT SENTIMENT INDEX: AUDUSD (APRIL 19, 2019) (CHART 2)
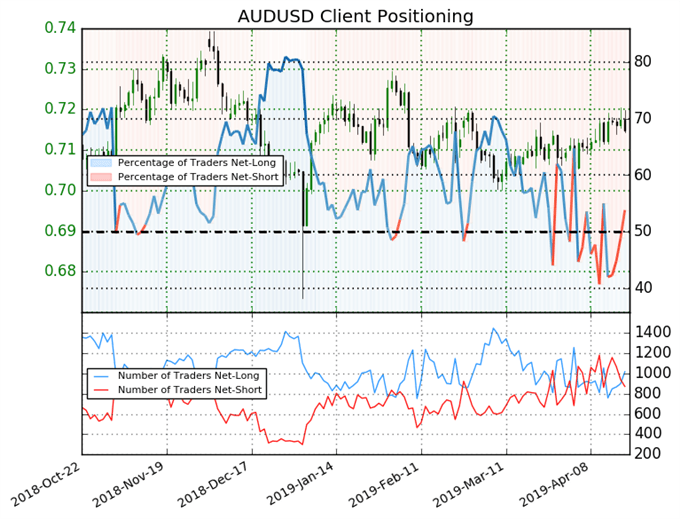
AUDUSD: Retail trader data shows 53.8% of traders are net-long with the ratio of traders long to short at 1.17 to 1. The number of traders net-long is 19.4% higher than yesterday and 11.4% higher from last week, while the number of traders net-short is 25.2% lower than yesterday and 27.1% lower from last week.
We typically take a contrarian view to crowd sentiment, and the fact traders are net-long suggests AUDUSD prices may continue to fall. Traders are further net-long than yesterday and last week, and the combination of current sentiment and recent changes gives us a stronger AUDUSD-bearish contrarian trading bias.


