
The S&P Systematic Global Macro Index – Trending To New Highs
The S&P Systematic Global Macro Index (S&P SGMI) is a trend-following strategy that takes long or short positions in 37 constituent futures across equites, commodities, fixed income, and FX.
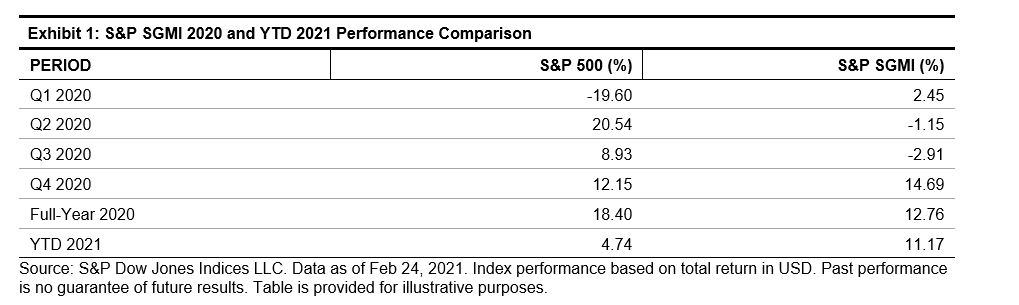
In 2020, the S&P SGMI did particularly well during the COVID-19-related drawdowns, finishing March up 11.3%, and closing the year at an all-time high. Thus far in 2021, the index has continued along this path, reaching new highs. As Exhibit 1 shows, the full-year 2020 return was 12.76% and the 2021 return is 11.17% YTD.
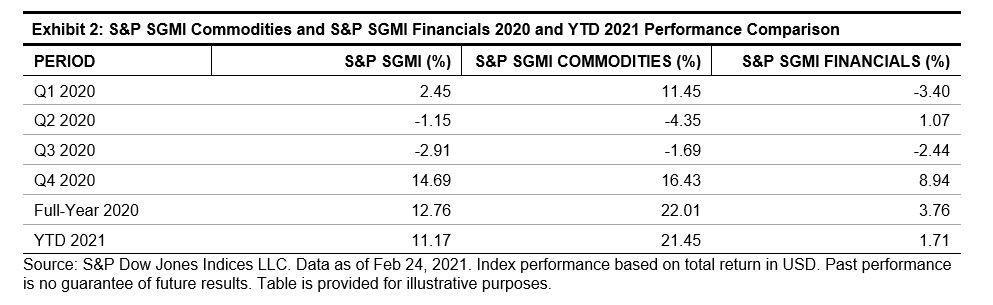
Much of the recent positive performance has come from commodities. This mostly occurred during the first quarter of 2020, when downward momentum in energy markets gathered pace, and Q4 2020 and YTD 2021, as vaccine news boosted hopes of an economic recovery and the U.S. dollar weakened.
To highlight the role that commodities played, Exhibit 2 shows the performance of two standalone subindices computed using the same methodology as the S&P SGMI. The first is the S&P Systematic Global Macro Commodities Index (S&P SGMI Commodities; the physical commodity futures component), and the second is the S&P Systematic Global Macro Financials Index (S&P SGMI Financials; the equity, fixed income, and FX components).
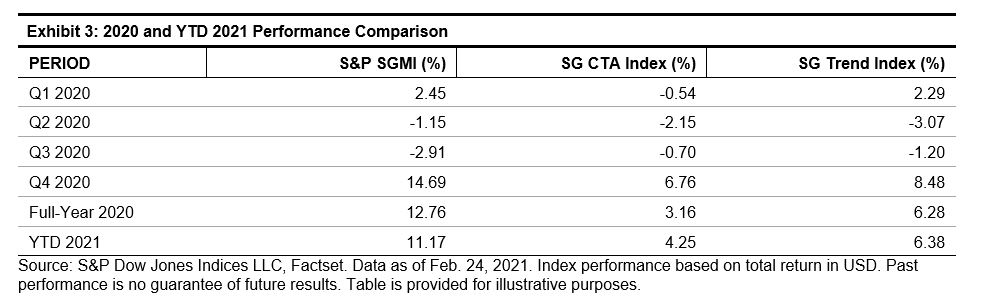
Notably, the performance of the S&P SGMI significantly exceeded that of its peers, the SG CTA Index and the SG Trend Index. The SG CTA Index tracks the performance of a pool of commodity trading advisors (CTAs) selected from larger managers that are open to new investment. The SG Trend Index is a subset of the SG CTA Index, and follows traders of trend-following methodologies.
As Exhibit 3 shows, the S&P SGMI outperformed the SG CTA Index and the SG Trend Index by 9.60% and 6.48%, respectively, for the full-year 2020 and by 6.92% and 4.79%, respectively, so far in 2021.
How Does the Index Work?
The S&P SMGI rebalances monthly and the methodology involves two core steps: the position direction decision and the weighting decision.
The Position Direction Decision:
The goal of the trend-following algorithm is to identify the most current, statistically relevant trend by assessing each constituent future independently, using an iterative process.
A linear regression is used to determine if the constituent future is in an upward or downward trend. If the regression slope coefficient is positive (negative), the component is deemed to be in an upward (downward) trend.
While the length of a particular trend will vary, the S&P SGMI uses the most recent period during which the trend was stable. This is determined using an iterative process that starts with a 22-day period and tests additional 5-day increments until the longest stable trend is identified using a statistical test.
The Weighting Decision:
The index allocates risk capital evenly across and within each of the sectors with the goal that no single sector or constituent drives the volatility of the index. The weights are then leveraged to meet the volatility target subject to a 3x leverage constraint.
Conclusion
Trend-following strategies can play an important role in client portfolios, offering diversifying return sources that may improve risk-adjusted return over the long term. As we enter the second year of the COVID-19 pandemic, it will be interesting to see if the S&P SGMI’s strong performance continues.
Disclaimer: Copyright © 2021 S&P Dow Jones Indices LLC, a division of S&P Global. All rights reserved. This material is reproduced with the prior written consent of S&P DJI. Please ...
more

