
The Good, The Bad, The Bubble And The Downright Crazy
In this article I will examine current conditions and future trends in the U.S. economy and financial markets. U.S. and global stocks continue to be the standout performers, and thus have garnered most of the headlines. The S&P 500 index has risen 86% over the past five years. In a normal world this would suggest that the U.S. economy has been growing briskly, and is expected to remain hot for some time, which has been the dominant narrative in the media. In terms of longevity, the current economic expansion is definitely one of the best on record.
The U.S. economy has been growing for 103 consecutive months as of January 2018, which makes it the third longest expansion ever, and there is a good chance that we will break the record of 120 months set from 1991-2001. But, once we get past the employment numbers, the stock market’s spectacular performance is not well-supported by economic or financial fundamentals, the media’s glowing narrative notwithstanding. This means that one of the following must be true: economic growth and corporate profitability is about to shift into a higher gear; the stock market will suffer a sizable correction or even bear market in the next year or two; or 21st century markets have morphed into a world of pure imagination, where stock valuations can remain disconnected from economic reality forever.
Employment-related statistics are the most unequivocally positive, so that’s a good place to start. The national rates of unemployment (4.1%) and underemployment (8%) are now equal to the rates achieved at the peaks of the last 2 economic expansions. There are a record number of people employed in the U.S., and companies continue to add new workers at a pace not seen in almost 20 years.
The labor force participation rate is one of the few items of concern on the employment horizon. The participation rate is the percentage of work-eligible adults who are employed or looking for work. This rate is now 5% lower than during the expansion of the 1990s. According to the Brookings Institution, labor force participation has fallen most dramatically for veterans and workers with less than a high school education. An increased reliance on disability insurance and a mismatch of worker skills vs. available jobs also affect people’s decision to seek work. Another troublesome point concerns the millennial generation. According to the Pew Research Center, more 18-34-year-olds live at home with their parents vs. any other living situation. Not surprisingly, that age range also has the highest rate of unemployment compared with any other demographic. (But don’t worry – survey evidence shows that millennials consider themselves happier and more socially connected than their parents.)
With the employment picture looking relatively rosy, next we’ll take up the thorny topic of growth, another topic we’ve heard a lot about on both the state and national level. Exhibit 1 shows annualized growth in real GDP since the Reagan era. Growth in the U.S. has been slowing steadily for over 35 years. The text boxes show that the average annual rate of growth has declined by exactly 0.8% per year for each of the four expansions since 1982.

Exhibit 1: Real GDP Growth
One of the basic building blocks of “growth” is the rate at which companies grow their revenues and profits. Exhibit 2 shows that aggregate revenues and profits for all S&P 500 companies grew steadily immediately following the financial crisis. Since 2014, however, S&P 500 revenues have grown at a sluggish pace (1.3% per year), and the profits of these companies have been decreasing at an average rate of –1.1% per year. This is unusual for a period of economic expansion.

Exhibit 2: S&P 500 Revenue and Profit Growth
The S&P 500 is made up of larger, more mature companies, so it would make sense to think that smaller, younger companies are the ones that are growing faster. Exhibit 3 shows the aggregate revenues and profits of companies in the Russell 2000, an index of smaller stocks in the U.S. From 2014-2017 the revenues of these companies have grown faster than their S&P 500 counterparts, at an average rate of 3.9% per year. But, as the exhibit shows, their profits have been stuck in a volatile sideways trend for years. Aggregate profits in 2017 are lower than they were as far back as 2011. Again, these facts contrast with the media’s narrative of a briskly growing real economy.

Exhibit 3: Russell 2000 Revenue and Profit Growth
Exhibit 4, which shows the cumulative percentage rise in the S&P 500 and these companies’ profits since 1982, illustrates why we care if stock prices rise rapidly without support from financial fundamentals like revenues and profits. First, notice how stock valuations have risen faster than profits during the last 3 economic expansions. Further notice that when the disconnect between profits and stock prices grows too large, the market becomes susceptible to bear market corrections or crashes, like the dramatic declines of 2000 and 2008. The graph shows that, as of year-end 2017, the disconnect between corporate profitability and stock valuations has never been greater. If investors ever start to care about valuation, as they always have at some point during past expansions and bull markets, U.S. stocks have a long way to fall before prices sync back up with profits.

Exhibit 4: Growth in the S&P 500 Index and Profits
Of course, another way to repair the profit/stock price disconnect is for profits to start growing faster for an extended period. And, we’ve been told that the recent round of cuts to federal tax rates are the secret sauce that’s going to jolt profit growth into high gear. Based on simple arithmetic, lower taxes have to result in higher profits to some degree. (Citizens of the state of Kansas are still waiting for the “jolt of economic adrenaline” that was promised by their soon-to-be-former governor.)
Of course, the best way for businesses to grow is to invest in new long-lived assets and infrastructure that grows their customer base and leads to higher sales. But, despite holding record levels of cash and historically low borrowing rates, U.S. businesses haven’t increased spending on capital goods since 2011 (see Exhibit 5, which shows that consumers’ overall appetite for long-lived purchases, known as durable goods, hasn’t grown either). Instead of spending their cash on new investments, corporations have been buying back their own stock at record levels every year – an easy trick that juices stock prices, but does nothing for future revenues and profits. Incredibly, S&P 500 companies have directed over half their annual profits to buying back their own stock in recent years. Before regulations regarding stock price manipulation were loosened in 1982, companies avoided buying back stock. But stock repurchase has steadily grown in popularity since then, and investment in long-lived assets has declined. These points provide a transition to the information in the next exhibit.

Exhibit 5: Growth in Durable and Capital Goods Orders
Exhibit 6 shows the long history of yields on 10-year U.S. Treasury notes and year-over-year growth in U.S. GDP. It is not a coincidence that the two rates track so closely together, especially starting in 1982. Central bankers (Greenspan, Bernanke and Yellen) have been obsessed with driving interest rates lower for decades, based on the idea that if companies and households could borrow cheaply, they would invest and spend more. But, as the graph clearly shows, the theory hasn’t worked – growth in GDP has declined in lockstep with interest rates as corporations have learned to take the easy way out – they have instead used low borrowing rates to leverage up and buy back stock to the point where long-term investments in capital goods, and thus growth in revenues and profits, has suffered.
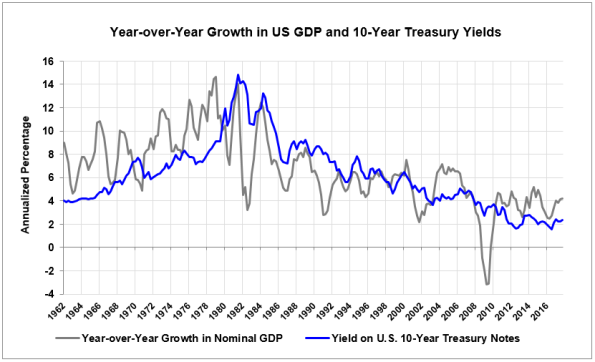
Exhibit 6: Growth in GDP and 10-Year Treasury Yields
What this era of low interest rates and loose regulatory oversight has instead given us is distorted markets – and not just in the sense of the stock price/profit disconnect described earlier. What follows is a list of developments that make the most sense when each is preceded by the phrase “it might be a bubble if.” Ready?
- The bonds of major economic powers like Germany and Japan now have negative yields, all the way out to 5-year horizons. This means that large purchasers of these instruments, like pension funds, are content to tie up their money for as long as five years just to receive zero interest and less than their full principal investment back.
- The yield on a 10-year Italian government bond is lower than the yield on a similar instrument issued by the U.S. government. That’s Italy we’re talking about – the country that spent all of 2017 bailing out Italian banks.
- The newly-issued debt of another insolvent country, Greece, has been one of the hottest investments in 2017. Their 10-year bonds were yielding 8% one year ago, but have been bought up with such enthusiasm they now yield only 4.5%, a scant 1.5% premium over U.S. Treasuries of a similar maturity.
- If you think U.S. stocks have been hot, you should check out Japan, whose stock market is up over 120% over the past 5 years. What’s driven their bull market? The Bank of Japan now owns 10% of their home country’s stock market.
- And Japan is not alone. The Swiss National Bank has bought up shares of the Swiss stock market in a similar proportion.
- After their CEOs threatened to fire anyone caught trading in Bitcoin just months ago, J.P. Morgan and Goldman Sachs have done an abrupt about face and are now clearing Bitcoin futures contracts.
- If you’re in the mood to gamble away your retirement savings, financial markets are ready to support your decision. Special IRA products are being introduced that will allow you to direct your retirement savings into cryptocurrencies like Bitcoin.
- If Bitcoin is not your thing, Goldman Sachs and Morgan Stanley have begun securitizing student debt, so you can retire fat and sassy based on students’ ability to repay the $1.5 trillion owed in student loans (a number that now grows $100 billion every month). Remember, the last financial crisis was triggered when people stopped paying their subprime mortgages, which had been securitized and sold to pension funds and insurance companies.
- In addition to buying trillions of dollars in bonds since the financial crisis, the U.S. Federal Reserve accidentally revealed that they have been the number one short-seller of stock market volatility in recent years, in an attempt to make financial conditions appear safer than they really are.
So there you have it. Based on everything you’ve read, you might think I’m recommending that investors hold 100% cash and hunker down for the next crash. But I’m recommending just the opposite. I have never seen a better-justified bubble – global central banks, the financial media, and just about every financial advisor on earth are as bullish as they have ever been.
This market has a momentum to it that exceeds even the late 1990s tech bubble. I think investors’ willingness to suspend their disbelief has a long way to run. My prediction is that U.S. and global stocks are going to continue their melt up well into 2018, and possibly longer, and the disconnect between fundamentals and asset values will keep growing. Your guess is as good as mine as to what will trigger the next financial crisis, but it’s coming. It’s just not here yet.


Clearly fear of losing out has taken the upper hand. My suggestion for late entries such as the writer is, if you are getting in this late, to shop for lagging stocks which are only being suppressed because many investors can't handle owning anything but rockets anymore and are dumping anything else without regard to fundamentals.
Thanks for your comment. I did not mention my personal portfolio holdings in the article, however. No worries -- I've been "all in" since 2009. Best regards.
Nice job, I'll count this article among my "good" list.