
The ETF Portfolio Strategist: Week Ending March 20, 2021
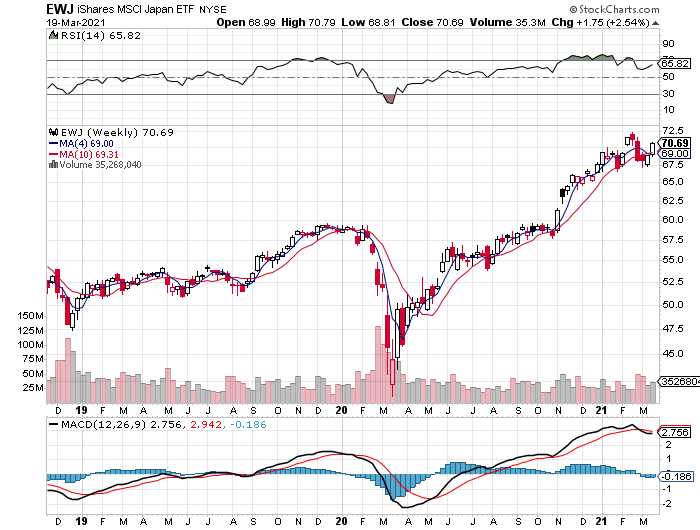
Japan shares rallied for a second week: In a mostly down week for global markets (through Mar. 19), Japan’s equity market stands out with a strong 2.5% gain, based on iShares MSCI Japan ETF (EWJ). The rally marks the second straight weekly advance, offering some ballast against widespread losses for US and European stocks.

Shares across Asia ex-Japan also ended with a gain this week, although just barely. The iShares MSCI All Country Asia ex-Japan ETF (AAXJ) managed to eke out a 0.2% increase for the trading week, but the rise comes after four relatively hefty weekly declines and so it’s open for debate if this regional benchmark’s correction has run its course. For details on strategy design rules and risk metrics cited in this article, see this summary.
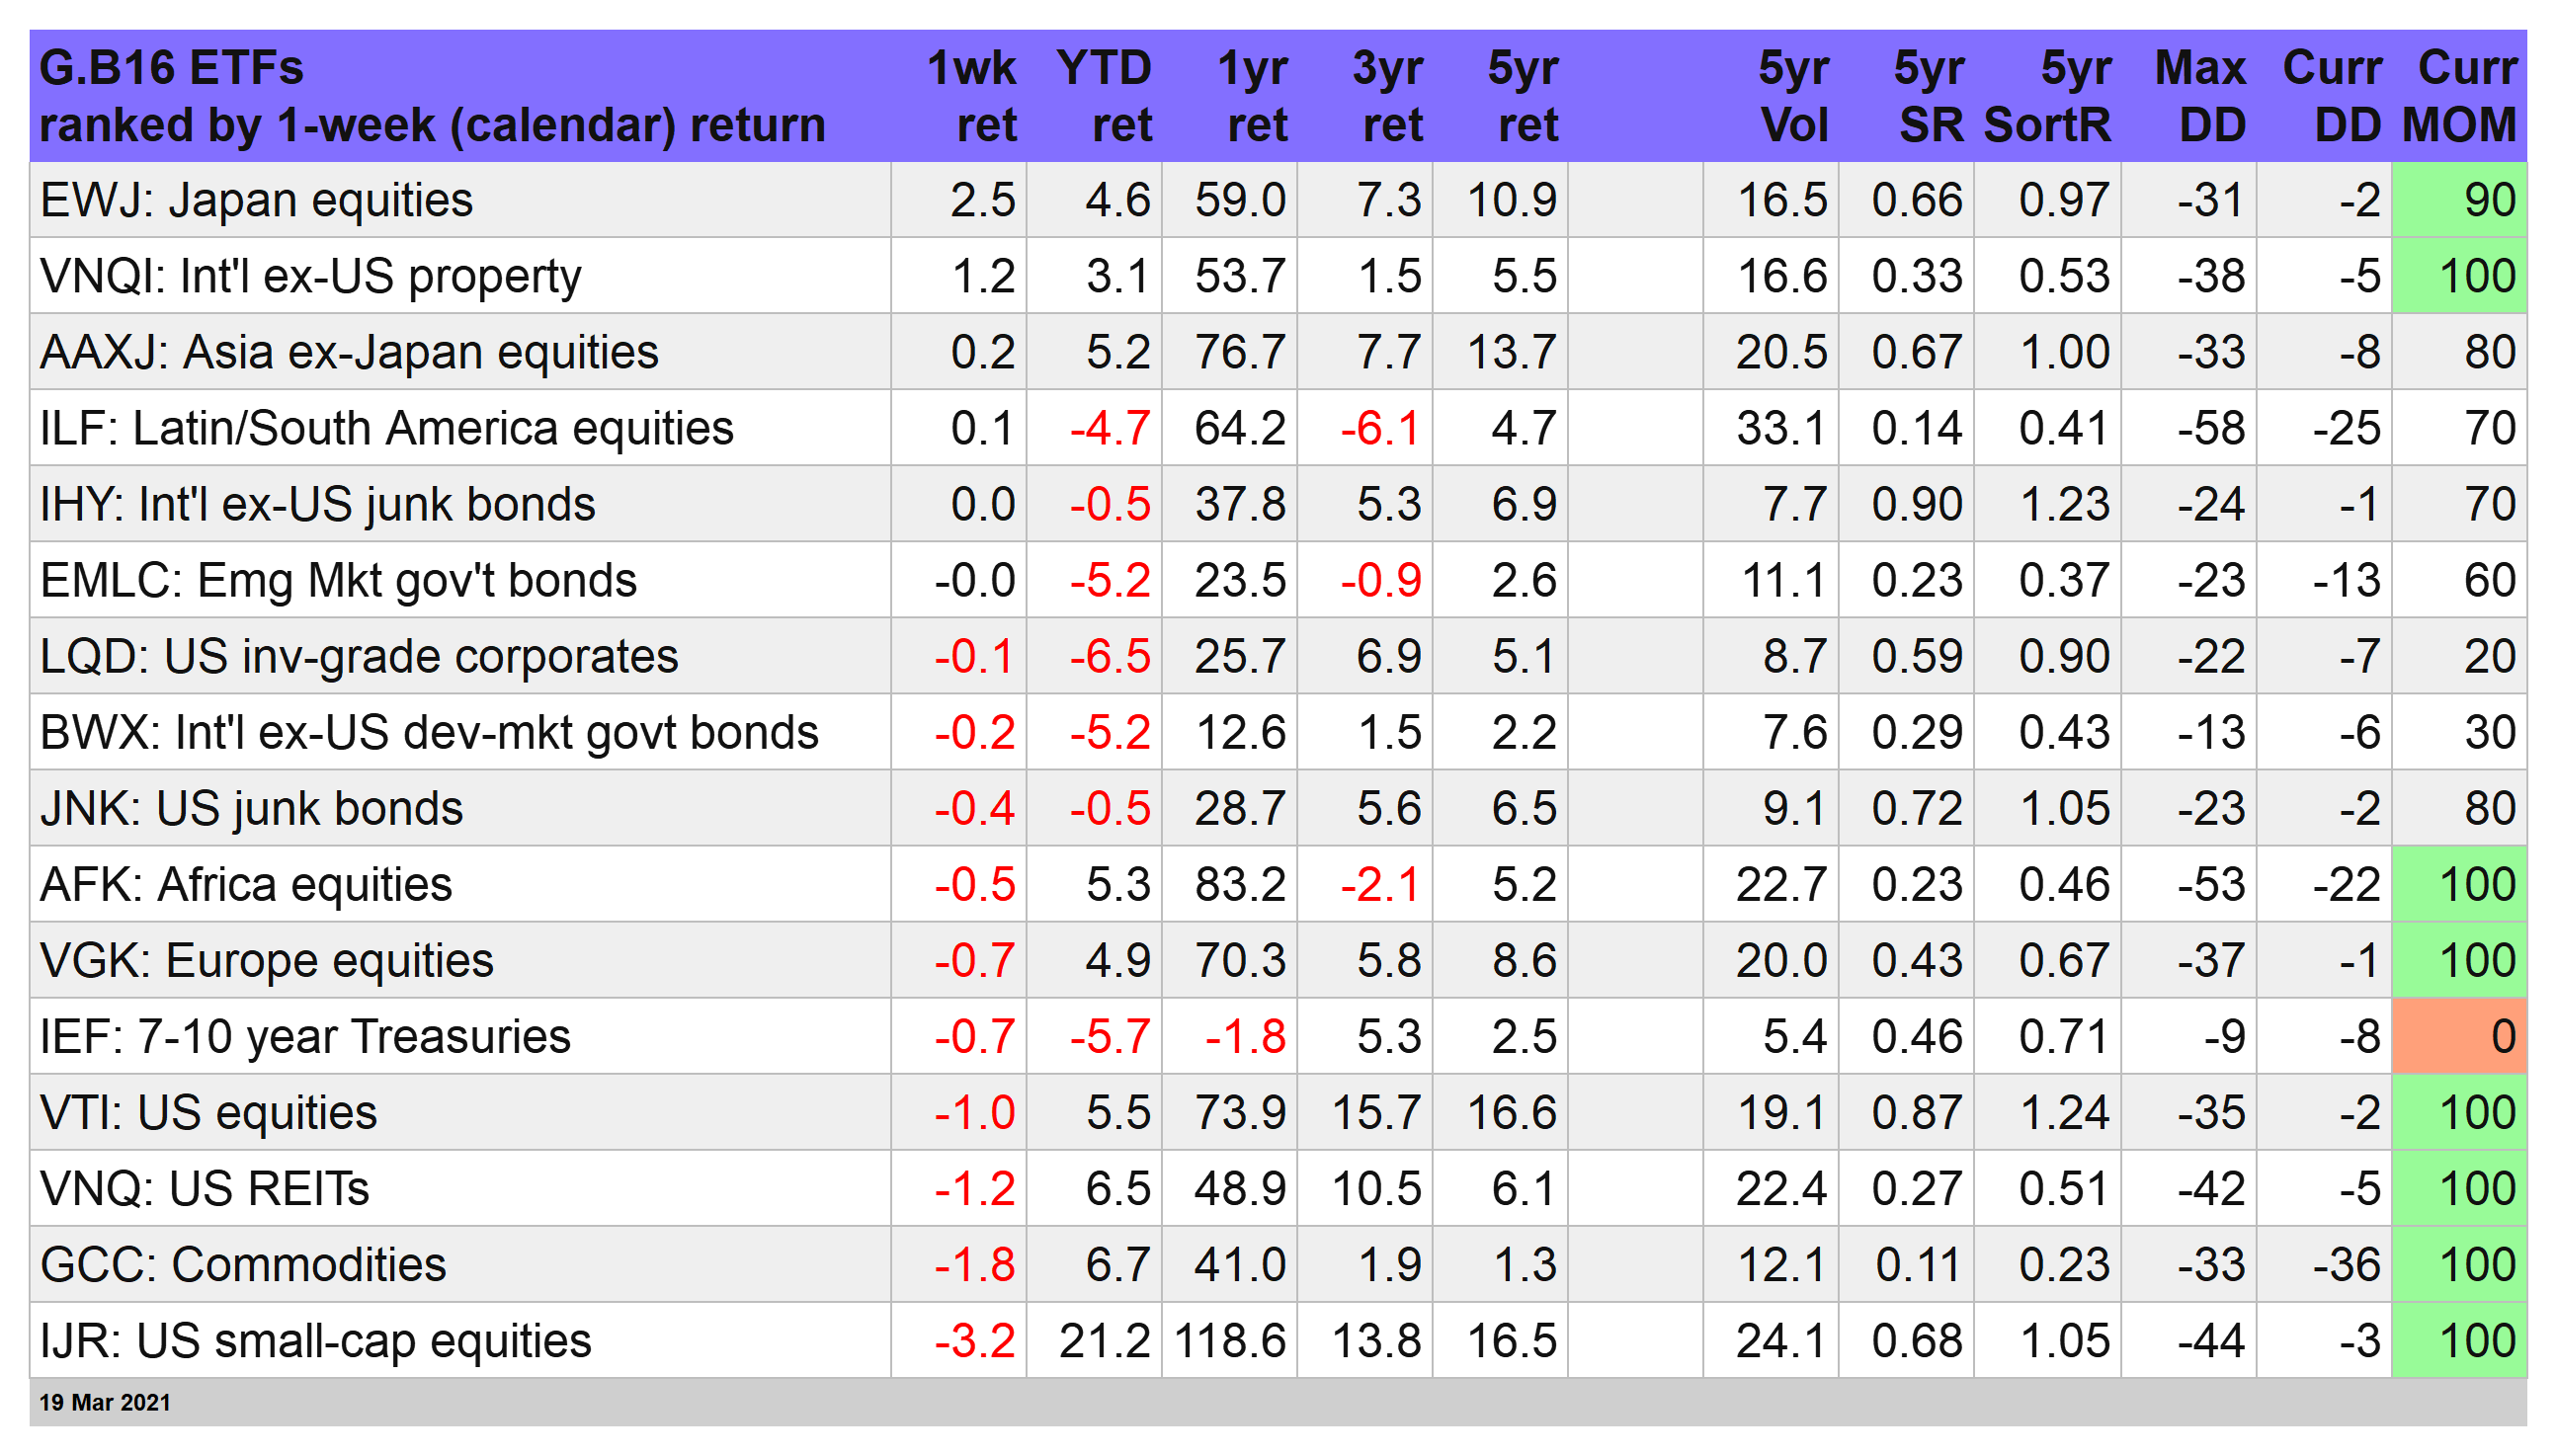
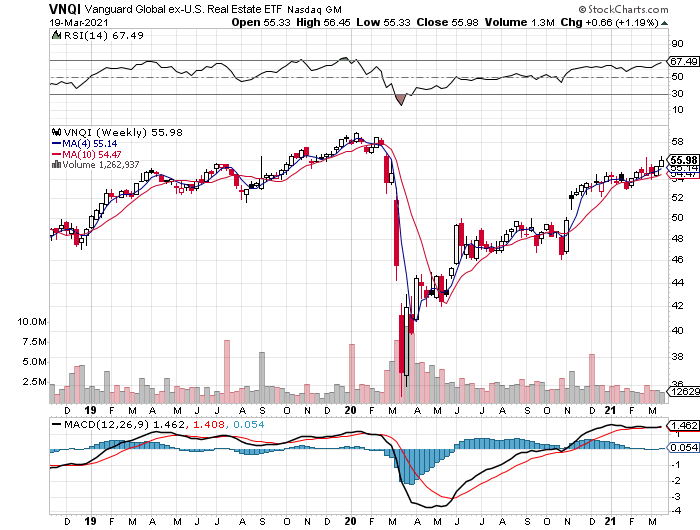
Foreign property shares, by contrast, continue to post a strong upside trend. Vanguard Global ex-US Real Estate ETF (VNQI) rose 1.2% this week, the second-best performance for our ETF opportunity set for the major asset classes. Although VNQI has yet to reach its pre-pandemic highs, its upward trajectory remains solid and looks on track to make more upside progress in the near term.
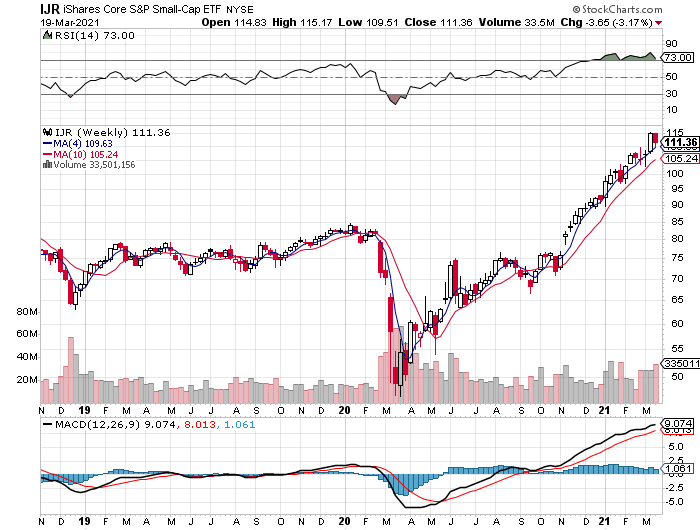
Overall, most slices of the global markets lost ground this week. The biggest loser in our global opportunity set: US small-cap equities via iShares Core S&P Small Cap ETF (IJR), which shed 3.2%. But for the moment, this still looks like a correction in a long-running rebound for previously suffering small caps.
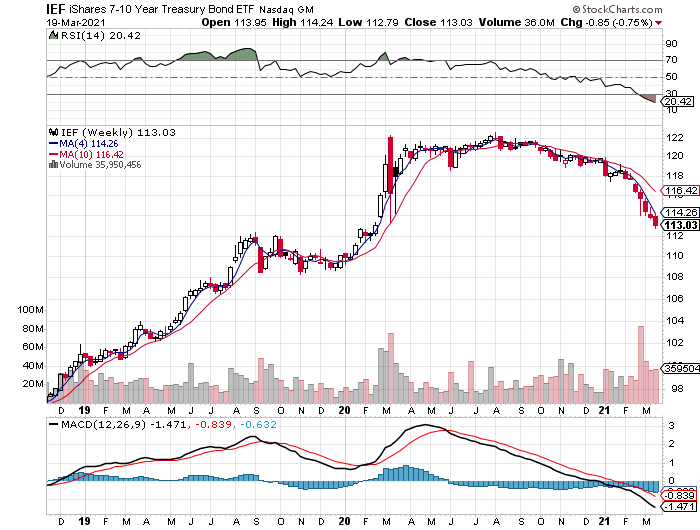
Meanwhile, the bond bear market continues to endure. Among this week’s losers: iShares 7-10 Year Treasury Bond (IEF), which dropped 0.8% -- the fund’s seventh straight weekly decline. The culprit, of course, is rising Treasury yields. The 10-year yield rose again this week, rising to 1.74%, the highest in 14 months, and for the moment further upside action appears likely. As a result, IEF still looks headed lower.
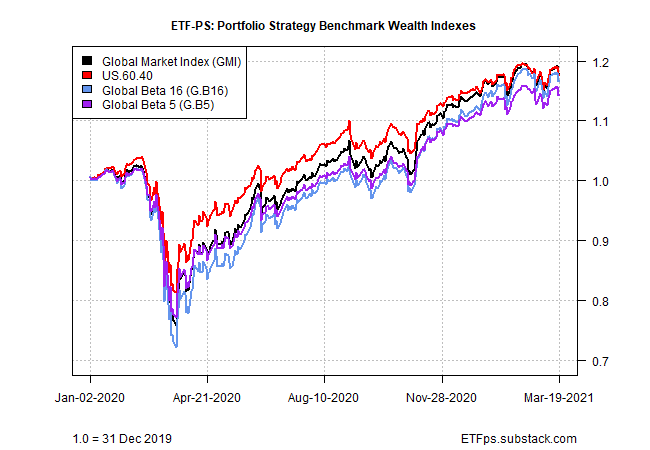
Global diversification took a hit this week: The red ink in global markets was too much to overcome for our portfolio strategy benchmarks. The setbacks ranged from 0.5% to 0.7% losses.
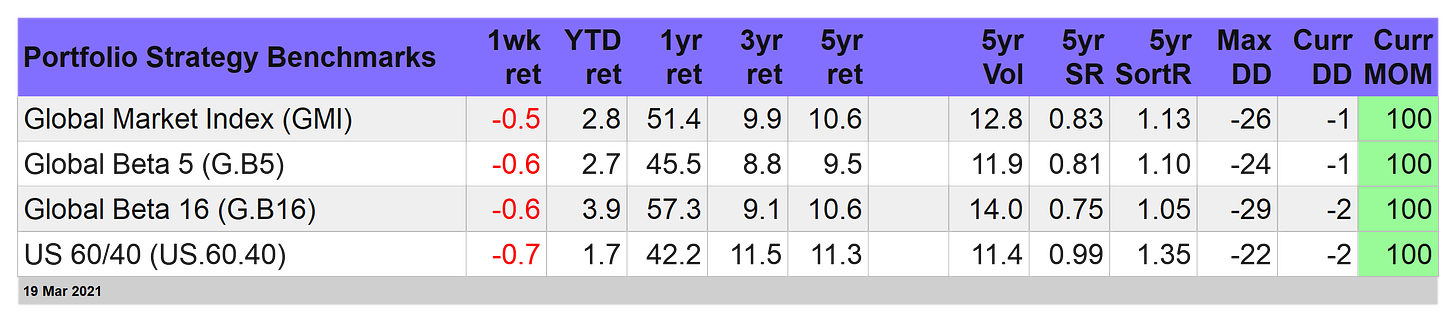
The retreats aren’t particularly surprising when you consider that all the portfolio benchmarks are posting strong trailing returns over the past several years. The high performance (for a global asset allocation benchmark) implies that some degree of backing and filling is likely this year. All the more so as markets try to digest the implications of rising interest rates, which could continue to rise further if the global economic outlook is as bright as many economists say it is.
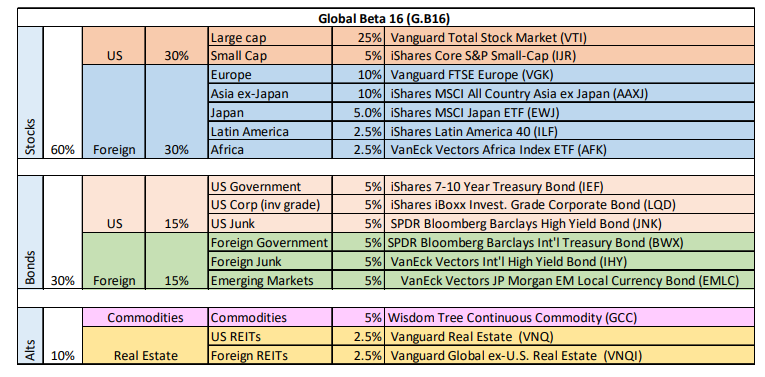
Regardless of what comes next, owning the major asset classes on a global basis has delivered strong returns for, say, the past five years. Global Beta 16 (G.B16), which holds all 16 funds in the table above in quasi market weights, is up an extraordinary 10.6% annualized since 2016. That’s unusually high and probably unsustainable for this benchmark and so we’re expecting to see more corrections (or at least an extended sideways action) in the near term.
Disclosures: None.


