
Terrifying Charts Show China's Economy Remains Completely Paralyzed
In our ongoing attempts to glean some objective insight into what is actually happening "on the ground" in the notoriously opaque China, whose economy has been hammered by the Coronavirus epidemic, last week we showed several "alternative" economic indicators such as real-time measurements of air pollution (a proxy for industrial output), daily coal consumption (a proxy for electricity usage and manufacturing) and traffic congestion levels (a proxy for commerce and mobility), before concluding that China's economy appears to have ground to a halt. These observations were subsequently reaffirmed when we showed that steel demand, property sales, and passenger traffic had all failed to rebound from the "dead zone" hit during China's Lunar New Year hibernation.
Meanwhile, as every investor scrambles for clues to find the upward inflection point in China's economic output which would at least partially validated the unbridled euphoria in the stock - and, ironically, the bond market - we have some unpleasant news: more than one week after our initial report on "alternative" high-frequency (read daily) indicators in China's economy, any tangible improvement in China's economy has yet to be observed.
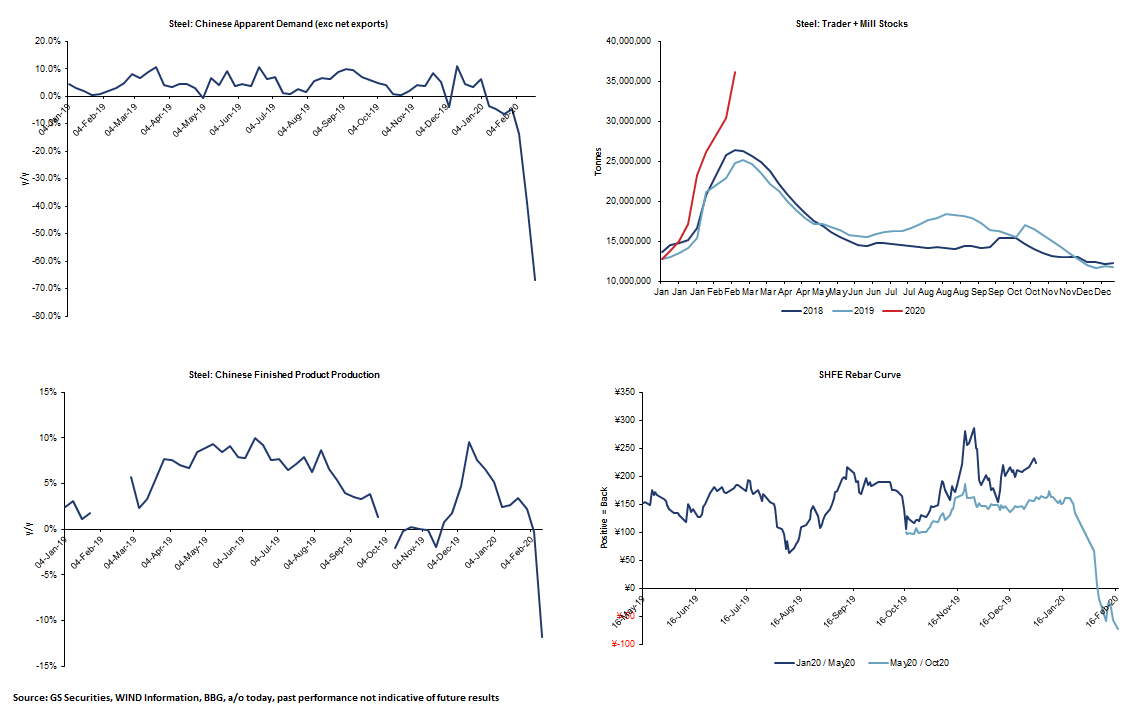
We start with some base commodity market observations courtesy of Goldman Sachs, which when looking at preliminary weekly demand data, finds that:
- Finished product production -7.4% w/w
- Mill stocks +18% w/w
- Trader stocks -19% w/w
According to Goldman's Adam Gillard, the above implies full country apparent demand is down a massive -66% y/y.
(Click on image to enlarge)
Picking up where Goldman (and we) left off, UBS writes that while there are official announcements for each province or city to end the extended Chinese New Year (CNY) holidays, "the actual work resumption faces many constraints and is hard to track." And so, piggybacking on what Capital Economics did previously, UBS constructed a China Daily Activity Tracker to assess real-time development, which covers many of the same indicators we have already noted previously including:
- daily average transport congestion index for 100 cities,
- daily coal consumption of 6 large independent power plants (IPPs);
- daily property sales in 30 major cities;
- daily passenger volume; and
- weekly steel furnace operating rates.
Alas, as we have noted previously and as Goldman shows above, UBS' indicators show that "China's activities remain very subdued vs the same time after previous CNYs."
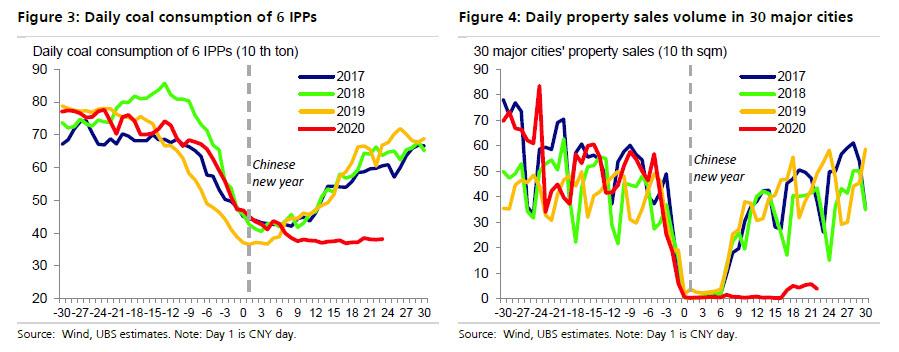
Here are some of the Swiss bank's key observations:
Coal consumption and property sales: Daily coal consumption of 6 large IPPs has been only 60% of average level of that in the same period in 2017-2019 (Fig 3). The daily property sales volume of 30 major cities is currently only around 10% of 2017-2019 average, but already up from a week earlier (Fig 4).
(Click on image to enlarge)
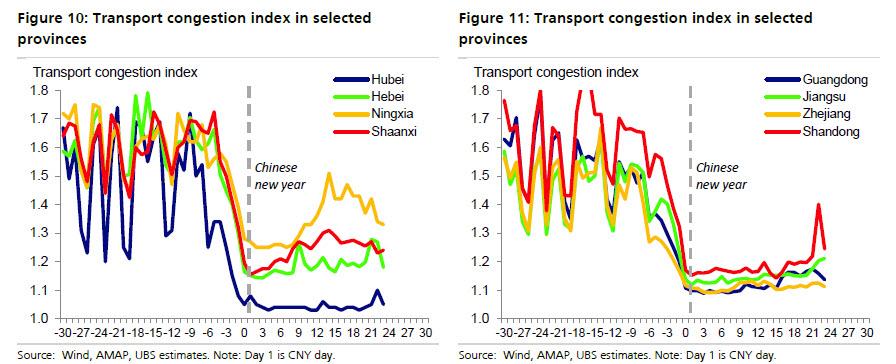
Transport congestion index: The index is measured as actual transport time relative to the theoretical time at free-flow speeds. 100-city average transport congestion index is below 1.2 of late, much lower than around 1.6 for the same period of 2017-2019.
(Click on image to enlarge)
![]()
(Click on image to enlarge)
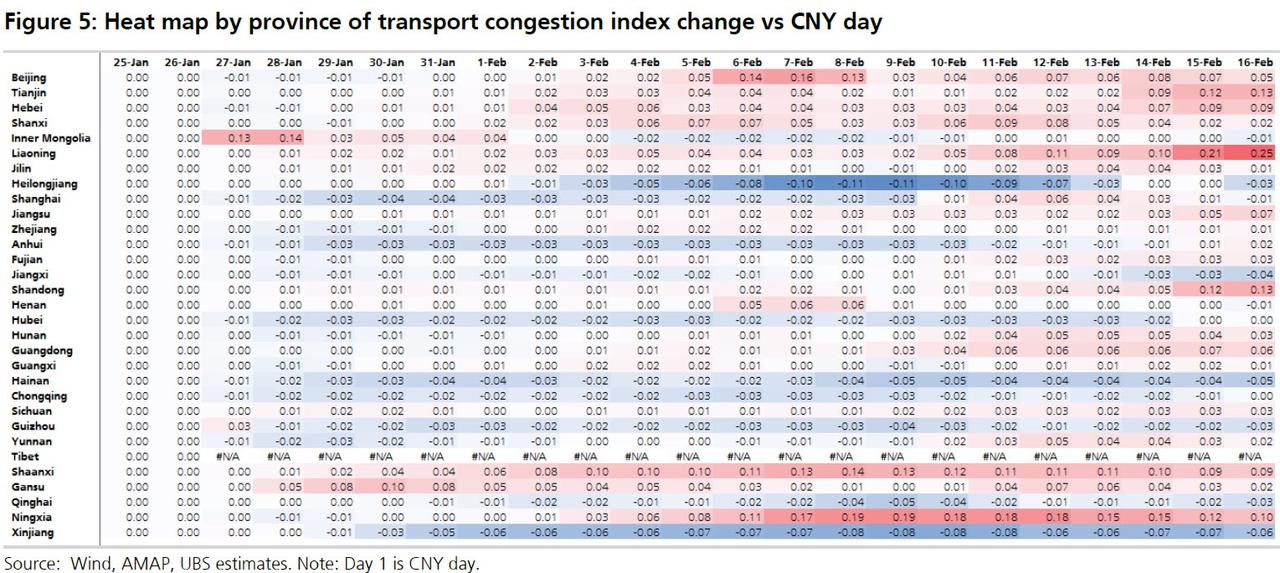
UBS also constructs a Heat Map by province in Fig 5 to show each province's index change compared with their previous low on Jan 25-26 (CNY day). As one would expect, there has been virtually no rebound for the vast majority of cities.
(Click on image to enlarge)
Passenger volume: Latest daily passenger volume is only 19% of that in the same period during CNY travel season in 2019 (Fig 12). Overall, total numbers of passengers carried has been around 18%, or 82% below, the 2019 level!
(Click on image to enlarge)

Accumulated passenger volume since the CNY day is 308mn person*time, 18% of 1.7bn person*time one year ago. While the drop is partly due to canceled trips, a big part is likely due to delayed returns of workers, who will eventually come back over the coming weeks, assuming, of course, China manages to contain the coronavirus and the population believes the communist government.
(Click on image to enlarge)

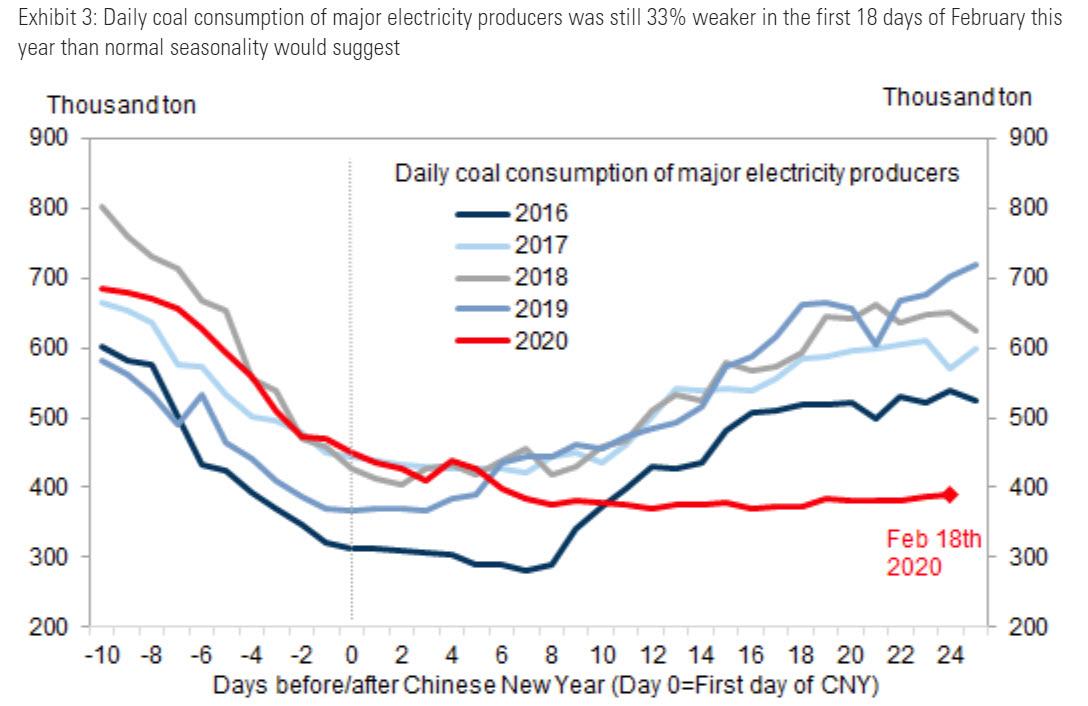
We then move to a similar daily-activity tracker, this time from Goldman which confirmed the terrifying paralysis China's economy finds itself in:
Daily coal consumption of major electricity producers was still 33% weaker in the first 18 days of February this year than normal seasonality would suggest. Needless to say, one can't claim there is even a remote possibility of a return to normal if electricity output (and demand) is running almost half compared to where it was this time last year.
(Click on image to enlarge)
The real estate market remains frozen. As Goldman notes, daily property sales volume in 30 major cities over the past week has climbed up to 13% of the average level in the previous 5 years. It was better than the 0% it was for much of the previous week.
(Click on image to enlarge)
![]()
Last but not least, while hardly coming as a surprise, movie box office revenues have been unchanged for the past three weeks, and remain frozen... at zero!
Disclaimer: Copyright ©2009-2020 ZeroHedge.com/ABC Media, LTD; All Rights Reserved. Zero Hedge is intended for Mature Audiences. Familiarize yourself with our legal and use policies every ...
more

