
Supply, Rates And Curve: What To Expect In 2H20 And Beyond
We probably haven't seen the last upward revision to European states deficits, but the ECB should absorb most of it. The duration and average maturity of supply should increase in 2021, justifying a gentle rise in interest rates, and a re-steepening of the EUR curve led by the long-end.
Source: Debt agencies, ING
Large scale ECB buying ...
European central bank government bond purchases have become a crucial factor for fixed income markets.
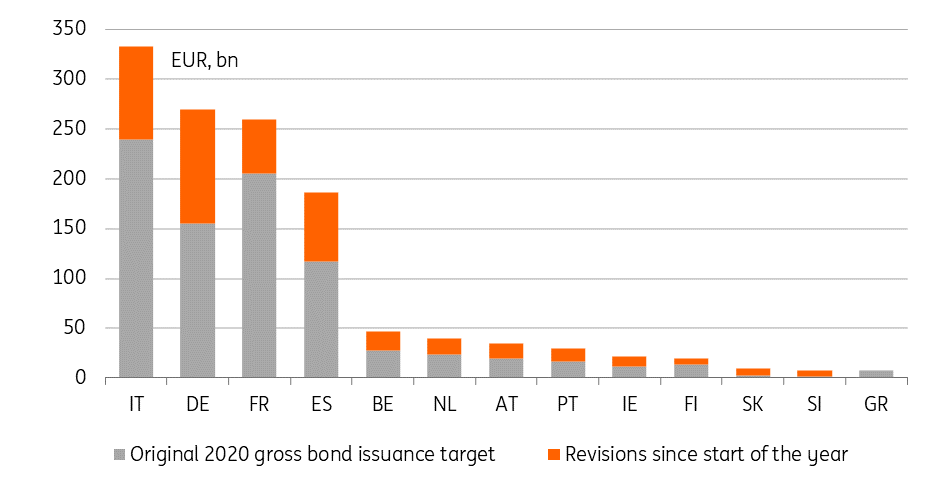
The sheer volume the ECB is willing to spend is unprecedented: €360bn via APP this year and €1350bn via the Pandemic Emergency Purchase Programme (PEPP) until mid-2021. But equally unprecedented is the sudden increase in governments' funding needs as they battle against the fallout from Covid-19.
The large part of this financing is raised via the issuance of government bonds. We estimate that this issuance could reach at least €1280bn this year, up from initial projections of around €875bn at the beginning of the year. In terms of net new supply, i.e. after subtracting bond redemptions, the figure still stands at €590bn.
If we make the assumptions that the split across asset classes stays roughly unchanged and also that the ECB will keep buying at the current speed for the rest of the year, we estimate that the central bank will buy around €870bn in public sector assets, excluding supranational such ESM and EFSF bonds.
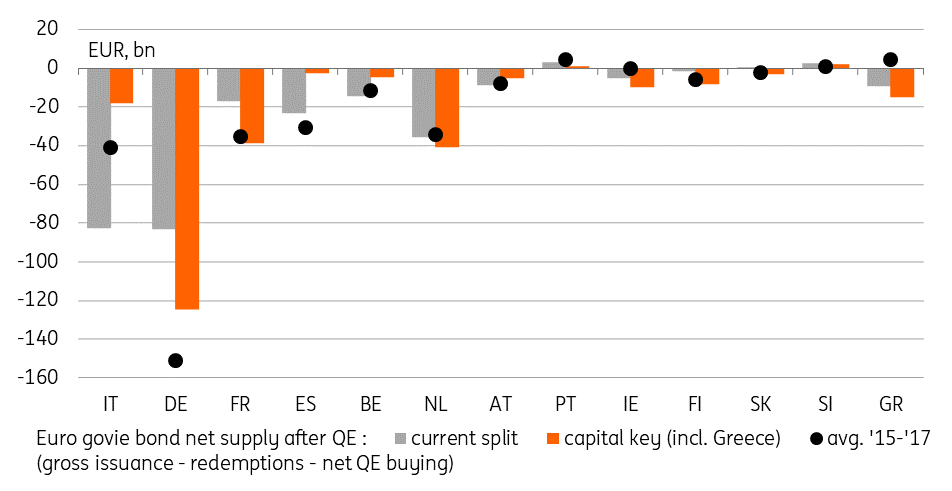
2020 EGB net supply after QE
Source: ECB, debt agencies, ING
For vastly increased funding needs
That, in turn, implies that the market, instead of having to absorb a net new supply of €590bn, is effectively facing withdrawal of €280bn in bonds.
The chart above shows which jurisdictions are likely to be the main beneficiaries of the ECB purchases. We depict a split according to that of purchases from March through May (the ECB releases data for the PEPP only every other month) and if the ECB were to strictly adhere to its capital subscription key.
While this back of the envelope calculation highlights the magnitude of the ECB intervention in bond markets, it does oversimplify matters, especially where the duration of purchases is a concern. Recall that with the launch of PEPP, the ECB has also included money market instruments in its list of QE eligible assets.
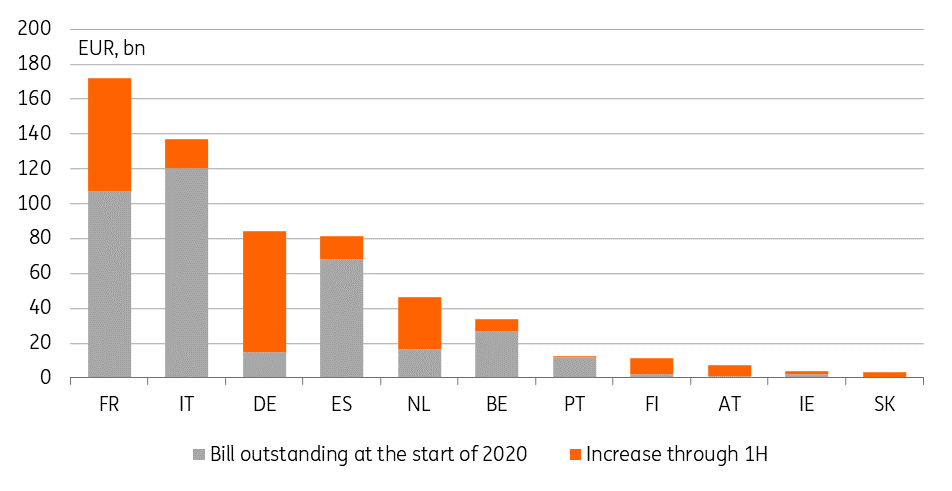
And governments have raised a lot of their initial funding via treasury bills. The aggregate outstanding bills have risen from €371bn to €593bn over the course of the first half of 2020. That is an increase of €222bn and we believe this figure could eventually double by the end of the year, raising the stock to more than €800bn. This then either needs to be rolled or – more likely in our view - termed out. As the PEPP reinvests until the end of 2022, it would make sense to use those two years to replace bills funding with bonds issuance.
Bills issuance was ramped up - and will potentially be termed out within the PEPP reinvestment period
Source: Bloomberg, ING
Stock vs flow: not all is priced in advance
Assessing the market impact of structurally higher debt stock is no trivial task.
Financial markets are forward-looking by nature and tend to reflect future flow in advance. In the case of debt sales and central bank purchases, they can typically be known a long-time in advance. This suggests a significant part of the increase in Eurozone sovereign debt issuance, and ECB purchases should be priced in already.
We’ve addressed that aspect of the stock effect of higher debt and higher central bank balance sheets in previous publications. We concluded that in the first phase of the crisis QE is priced with a higher degree of certainty than debt increases. This is particularly true in the case of PEPP due to the ECB’s professed preference for front-loading purchases. On the other hand, there is still much uncertainty about how wide deficits will be in the coming years as governments scramble more measures to support their economies. This, in short, justifies the sharp drop in interest rates this year, and our call for a gentle rise in the coming years.
It remains that if the future path for debt stock and ECB balance sheet can be largely predicted months in advance, the day to day flow of debt sales and purchases have a residual market impact that is far from negligible. This is the aspect we aim to study here. More specifically, we aim to assess the impact of changes in the total duration of debt available in the market on rates direction (parallel shifts upward or downward of the yield curve), and of the weighted average maturity of supply on the slope of the curve (when corrected for the impact of direction).
Rates direction: A gentle rise confirmed
That first aspect is probably the most difficult to track, but also the most important.
We estimate that since 2015, rates direction accounted for around 95% of the German curve’s volatility. In short, our conclusion is that it is more difficult to draw a strong inference about rates direction from the expected flow of debt sales and ECB purchases than before.
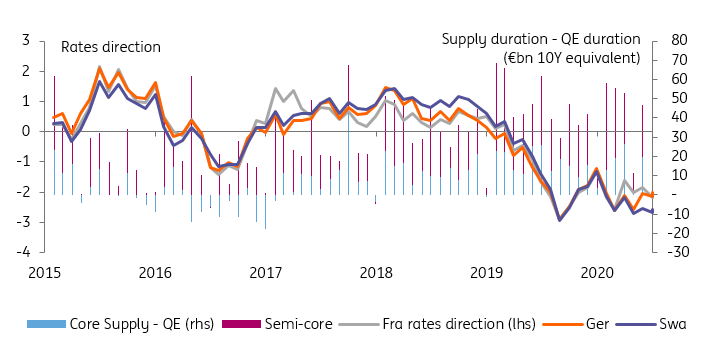
At the onset of QE, and particularly when the program was increased in 2016, the resulting squeeze on interest markets was evident: Central bank purchases resulted in a net reduction in the amount of duration available for other investors to buy. This was particularly true for core sovereign debt markets such as Germany and the Netherlands. The result was in line with expectations: interest rates dropped and reached an all-time low around the middle of 2016.
The flow picture has lost relevance since 2019 with a drop in rates not commensurate with the amount of duration being added to the market in 2019 by government issuance. That this discrepancy has subsided until now can easily be explained by the outsized risk posed by the COVID epidemic on the world economy.
More duration should lift rates - slowly
Source: Bloomberg, ING
Looking ahead, a combination of tapered QE and governments ‘terming out’ the large T-bills stock issued at the onset of this crisis brings the risk of a reversion higher in interest rates. We do not expect this to be a sharp move, however: the higher supply duration in the coming month will be dominated by an increase in the average maturity of debt, whilst deficits should shrink in 2021 compared to 2020.
Nor do we expect this to be a linear process. Supply seasonality is strong and so the market impact can be anticipated, to an extent. The next likely spike in supply duration should occur in September/October of this year. Its market impact would, of course, be dampened if the ECB decides to add to its QE target in the autumn.
The start of 2021 also promises to see a sharp increase in debt sales. The impact there will be harder to offset in our view and we expect rates direction to be skewed higher into January. Our end-2020 forecast for 10-year EUR swap rates now stands at only 0% but we acknowledge that markets might be tempted to price the Q1 2021 supply glut in December, bringing temporary upside risk to this forecast.
Maturity matters: re-steepening likely in 2021
The next aspect to study is the impact of the average maturity of supply on the curve slope. We focus here on the non-directional slope to account for the fact that EUR yield curve has been in a clear bull-flattening/bear-steepening trend. Put simply, most of the slope moves since 2015 are explained by rates direction. The residuals, accounting for roughly 5% of the yield curve’s volatility, is what we study here.
We think the ECB’s QE has played an important role in fostering a market environment favorable to long-dated sovereign issuance. This was most notable in 2016-17 with the average duration of core and semi-core supply regularly jumping above 10 years, and on occasions above 15 years.
This period coincided with the steepest yield curve of the past 5 years.
EUR curves are slightly flat currently
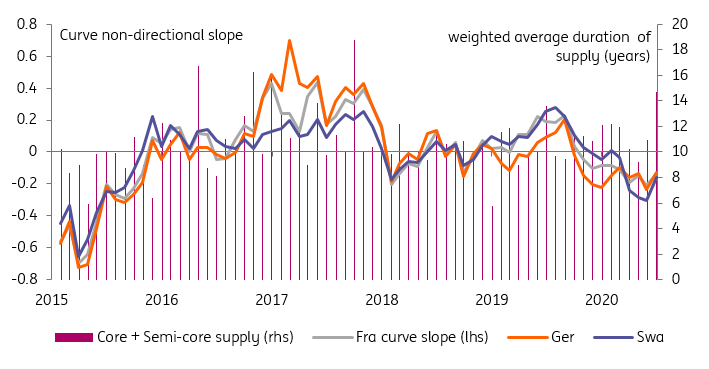
Source: Bloomberg, ING
Adjusted for the exceptionally low level of interest rates, EUR curves are flat but far from their most extreme levels.
One explanation in our view is that accounting for the surge in the stock of T-bills, the average maturity of debt sales has actually dropped sharply since March 2020.
As we explained above we view this as a transitory stage in the process of sovereigns terming out their issuance. Our base case is thus for EUR curve to steepen more than the gentle rise in interest rates would suggest, with the long-end likely to react first. Here too the Q1 2021 financing round seems a prime candidate for when this will occur, as a result, we expect EUR swap 10s30s to steepen to 35bp by the end of 2020.
Disclaimer: This publication has been prepared by ING solely for information purposes irrespective of a particular user's means, financial situation or investment objectives. The information ...
more

