
Stock Market Health Update For The Week Of June 6

Image Source: Unsplash
Last week was fairly flat, but the prior week saw a follow-through day to the upside. A follow-through day is often one of the first signals of a market turnaround, but since it sometimes comes too early, we need some other signals to confirm.
Some of those other signals have not occurred yet. That means I am considering a tentative uptrend. I am taking some swing trades in quality setups that I see, but I am not loading up. I will deploy more capital if conditions continue to improve.
How the Market Indexes Are Doing
I look at 4 different US indices because they each tell a different story about overall stock market health. The stock market is healthiest, and swing trading stocks on the long side is most profitable, when all these indexes are in uptrends. Here’s what each of the 4 indices represents:
- Nasdaq 100 – Tech stocks.
- S&P 500 – Large US companies.
- NYSE Composite – A wide array of stocks, varying in size and industry.
- Russell 2000 – Smaller companies.
2 Canadian stock indices are also included. The Composite tracks larger companies, while the Venture tracks very small companies.
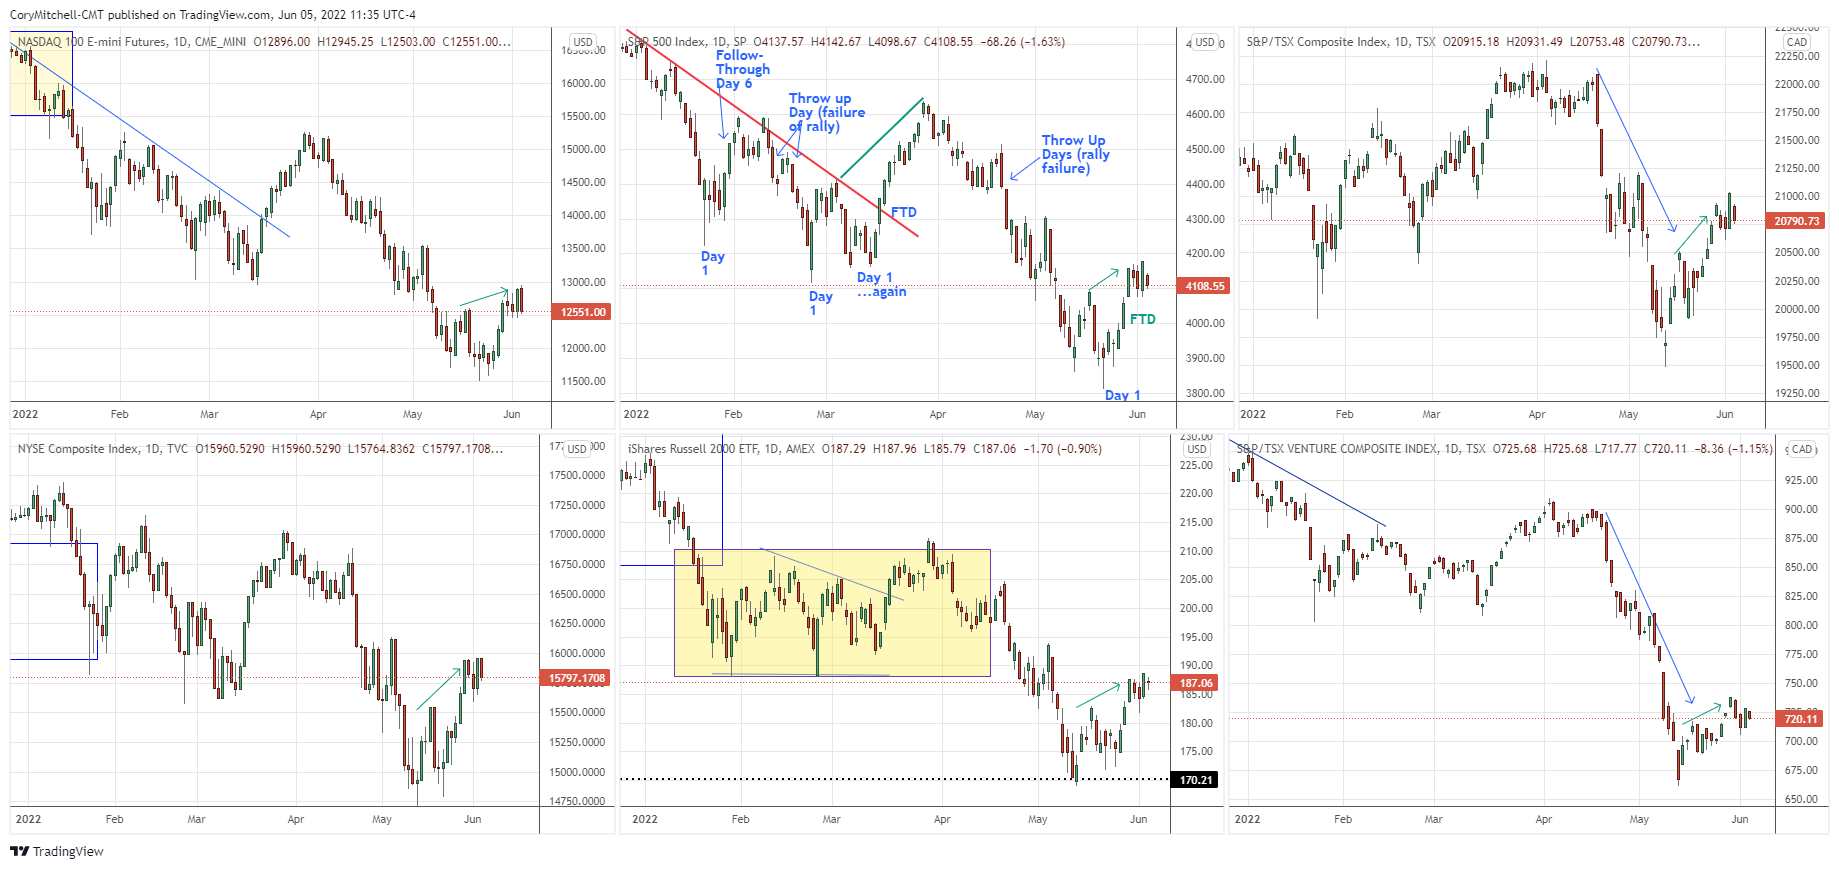
Charts are provided by TradingView – these are charts I personally use.
All the indices are currently pushing higher. The push higher so far is relatively small compared to the prior drops. On the positive side, each index has made a higher swing high recently (see green arrows) compared to the prior swing high which occurred around May 18.
This indicates a short-term uptrend that could turn into a longer-term uptrend, but that is not confirmed yet. For this reason, I’m taking some long swing trades in individual stocks that are setting up, but I’m not loading up because the longer-term outlook remains uncertain.
Most stocks move with the indices, so if they are performing questionably, then most stocks will be as well. I prefer to trade and deploy more capital when conditions are good and I have a higher chance of winning.
Right now, there are some good setups out there, so I will make a bit of money if I can (by deploying a portion of my capital), but my main goal is to preserve capital until conditions are looking really good.
State of the Market Health Indicators
The following chart shows the market health indicators I track. They tell me the condition of the stock market overall, and whether it’s a good time to swing trade individual stocks.
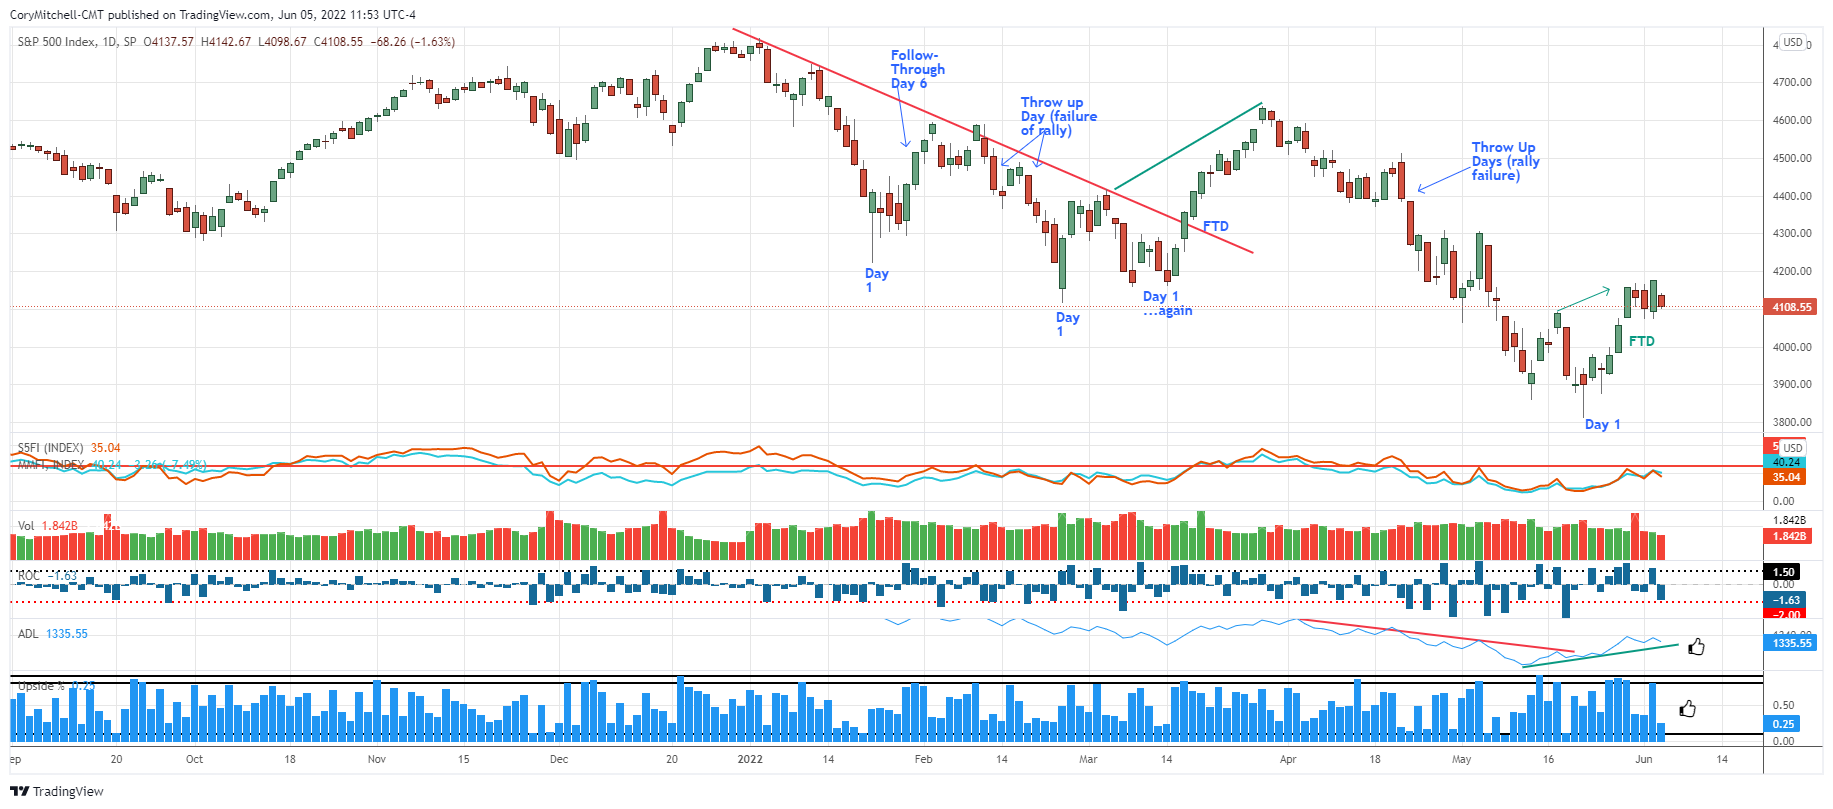
The market health indicators are improving.
- 40% of S&P 500 stocks are above their respective 50-day moving averages. 35% of all US stocks are above their respective 50-day moving averages. It’s generally much easier to swing trade profitably (on the long side) when more stocks are above their 50-day averages. When this indicator is below 50%, it tends to be sideways or a downtrend for most stocks/indexes. We are below 50, but we have been improving.
- Volume is not important at this exact moment. The higher volume on May 26 (relative to May 25), combined with the strong move to the upside in the S&P 500 created a follow-through day.
- The dark blue bars are the daily percentage movement of the S&P 500. Big moves are associated with downtrends and turning points. Small values are associated with an uptrend. Values of -2 are a warning sign anytime they occur. The daily movements are still volatile, which is indicative of a downtrend or turning-point action.
- The blue line is the cumulative NYSE Advance-Decline Line. It is showing positive divergence relative to the S&P 500. While the S&P 500 made a lower low on May 20 (relative to May 12), the AD Line made a higher swing low and has continued to advance with the S&P 500. The AD Line also moved above its May 4 high on May 27. The S&P 500 has not yet, which is another positive divergence.
- The columns of blue are NYSE up volume divided by NYSE total volume. It tracks buying and selling enthusiasm. Levels below 10% and above 90% are important (or back-to-back days above 80%). On May 13, there was a 90% upside. These often occur within a week or so of a bottom. This was followed by three 80%+ days in a row on May 25-27.
- The ultimate indicator is how many quality setups there are and how trades are working. I will be running a scan this week. Overall, I am happy with how stocks from the recent watchlists (that set up properly) have performed.
What I’m Doing Right Now
I am taking long swing trades. I am not loading up. I am willing to deploy up to about 25% of my capital to trades (this is mainly because the oil sector and some metal stocks are so strong. Outside of those sectors, there aren’t a lot of trades that interest me).
I will deploy more capital if I continue to see quality setups and market health indicators continue to improve. I will be creating a new watchlist on Tuesday. Here is last week’s watchlist which still has some names on it I am watching closely.
Disclaimer: Nothing in this article is personal investment advice, or advice to buy or sell anything. Trading is risky and can result in substantial losses, even more than deposited if using ...
more

