
Sterling Technical Analysis: GBP/USD Softens, Support In Sight
GBP/USD SOFTENS AFTER RE-APPROACHING 1.3000 BIG FIGURE
The bullish theme in the British Pound remains of interest as GBP/USD made another run at key resistance. As looked at yesterday, the 1.3000 level looms large as this is the area that held buyers at bay during the big breakout from the month of October. And with this being a major psychological level coming into play after the 1.2000 price was tested in early-September, the pair had run really far really fast already. At this point, buyers have been thwarted twice and are currently in the midst of a third test of this zone; but bid pressure has calmed and since yesterday morning, price action has been softening in the pair.
GBP/USD TWO-HOUR PRICE CHART
(Click on image to enlarge)
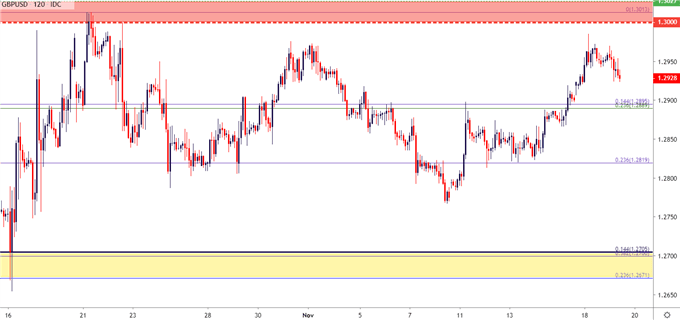
Chart prepared by James Stanley; GBPUSD on Tradingview
The early-November return of USD-strength helped to soften GBP/USD down to a low of 1.2767, but the pair began to trend higher even as the US Dollar remained strong; and when USD sellers came back into the fray last week, GBP/USD throttled-higher, making a fast run towards the same 1.3000 price that rebuked the topside advance last month, even testing above the lower-high from October 31/November 1. But that’s the point where buying pressure slowed again as bulls shied away from a re-test of the big figure.
GBP/USD HOURLY PRICE CHART
(Click on image to enlarge)
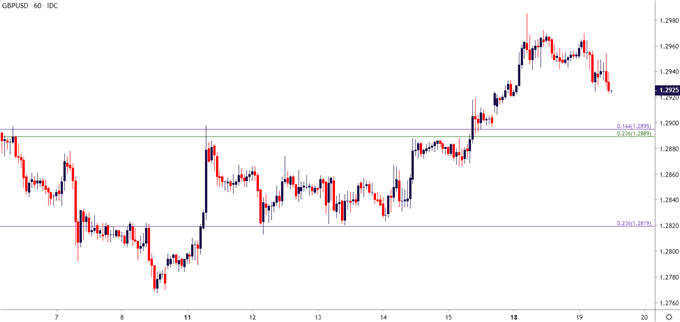
Chart prepared by James Stanley; GBPUSD on Tradingview
GBP/USD STRATEGY
Taking a step back, we essentially have a near-term case of mean reversion or range-bound behavior after a long-term level of resistance came into play off of the 1.3000 handle. And while this doesn’t eliminate the bullish potential in the pair, it does put those prognostications on the back-burner, at least for now.
Moving forward, traders can look to address this recent mean reversion/range with a bullish bias. As looked at yesterday, a potential zone of support rests around the 1.2900 handle that can re-open the door for as such. A bit deeper, another such zone exists around the 1.2825 level, which had provided a bit of support last week before GBP/USD price action pushed up to a fresh high. I had looked at that level for bullish scenarios last week and given the response, it remains an area of attraction for bullish exposure in GBP/USD.
GBP/USD TWO-HOUR PRICE CHART
(Click on image to enlarge)
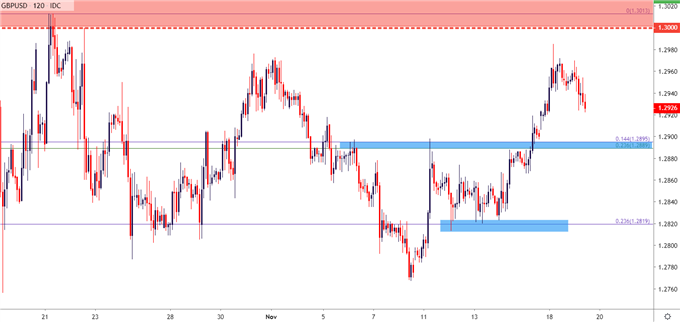
Chart prepared by James Stanley; GBPUSD on Tradingview


