
Sterling Price Outlook: British Pound Snaps Four Week Losing Streak
Sterling prices fell to lows not seen since January of 2017 early in the week before mounting a nearly 1% advance – the move offers a reprieve to the British Pound which has fallen nearly 10% off the yearly highs. But is this just a near-term relief rally, or the start of something bigger? These are the updated targets and invalidation levels that matter on the GBP/USD weekly price chart.
STERLING PRICE CHART - GBP/USD WEEKLY
(Click on image to enlarge)
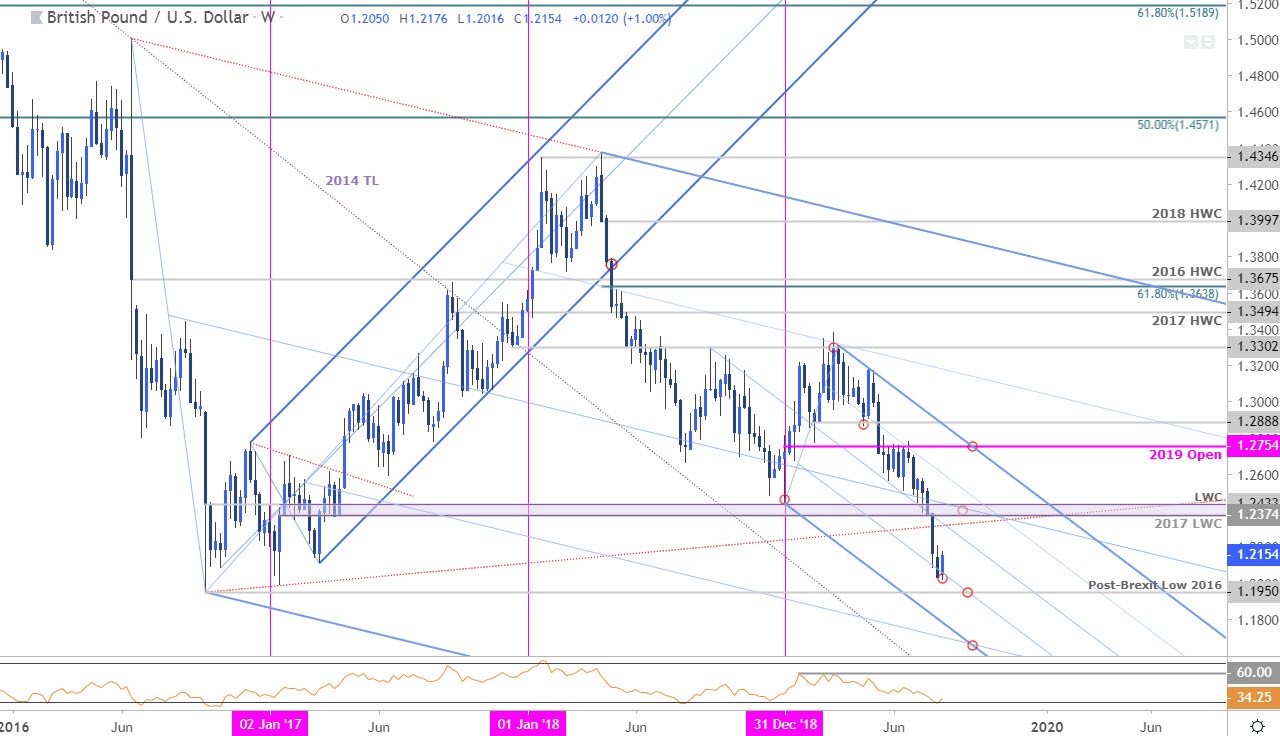
Chart Prepared by Michael Boutros, Technical Strategist; GBP/USD on Tradingview
Notes: In my last GBP/USD PriceOutlook we noted that Sterling was approaching a critical support confluence at, “1.2374-1.2433 – a region defined by the 2016 post-Brexit low-week close and the 2017 low-week close... A break/weekly close below would expose subsequent support objectives at the 61.8% extension at 1.2185.” Price plummeted through this target last week before briefly registering a low at 1.2013 early in the week. Sterling is responding to slope support on numerous timeframes here with price now poised to snap a four-week losing streak.
Initial weekly resistance stands with the median-line (currently ~1.23) with key resistance / near-term bearish invalidation now lowered to the 1.2374-1.2433 pivot zone. A break lower from here exposes the post-Brexit lows in GBP/USD at 1.1950; look for a reaction there IF reached – any lower risks a drop towards the lower parallels sub-1.17.
Bottom line: Sterling is testing down-trend support here and leaves the immediate short-bias vulnerable into the start of next week. From a trading standpoint, a good place to reduce short-exposure / lower protective stops. Look for possible downside exhaustion ahead of 1.2080 IF price is going to mount some sort of counter-offensive here. Ultimately a larger recovery may offer more favorable entries closer to trend resistance. I’ll publish an updated GBP/USD Price Outlook once we get further clarity on near-term GBP/USD technical levels.
STERLING TRADER SENTIMENT (GBP/USD)
(Click on image to enlarge)
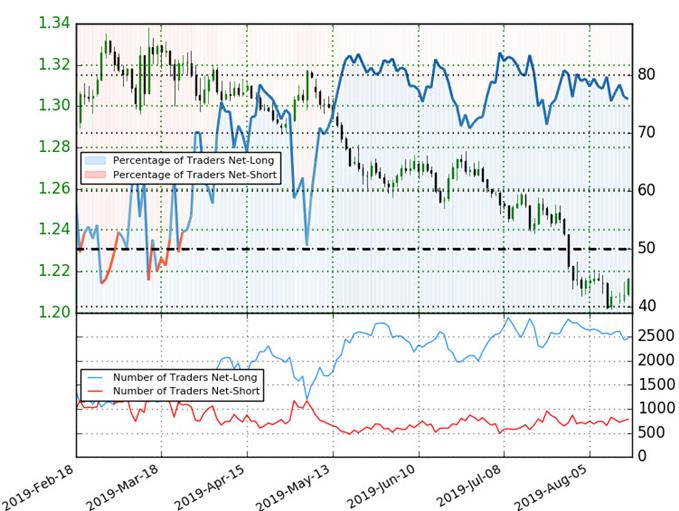
- A summary of IG Client Sentiment shows traders are net-long GBP/USD - the ratio stands at +3.13 (75.8% of traders are long) – bearish reading
- Traders have remained net-long since May 6th; price has moved 6.4% lower since then
- Long positions are 7.7% lower than yesterday and 5.7% lower from last week
- Short positions are 5.4% higher than yesterday and 0.1% lower from last week
- We typically take a contrarian view to crowd sentiment, and the fact traders are net-long suggests Sterling - GBP/USD prices may continue to fall. Yet traders are less net-long than yesterday and compared with last week. Recent changes in sentiment warn that the current GBP/USD price trend may soon reverse higher despite the fact traders remain net-long.


