
SPX, Gold, Oil And G6 Targets For The Week Of February 3rd
Last week noted that if selling pressure intensifies, and the index drops below support at the weekly pivot line at 3280, we can expect three to four weeks of selling action. As long as the index doesn’t drop below the confines of the uptrend channel in place since July ’209, or the trendline connecting the 2018 and 2019 highs, such bearish action should be viewed as an overdue and timely correction. We expect the above mentioned support to hold:
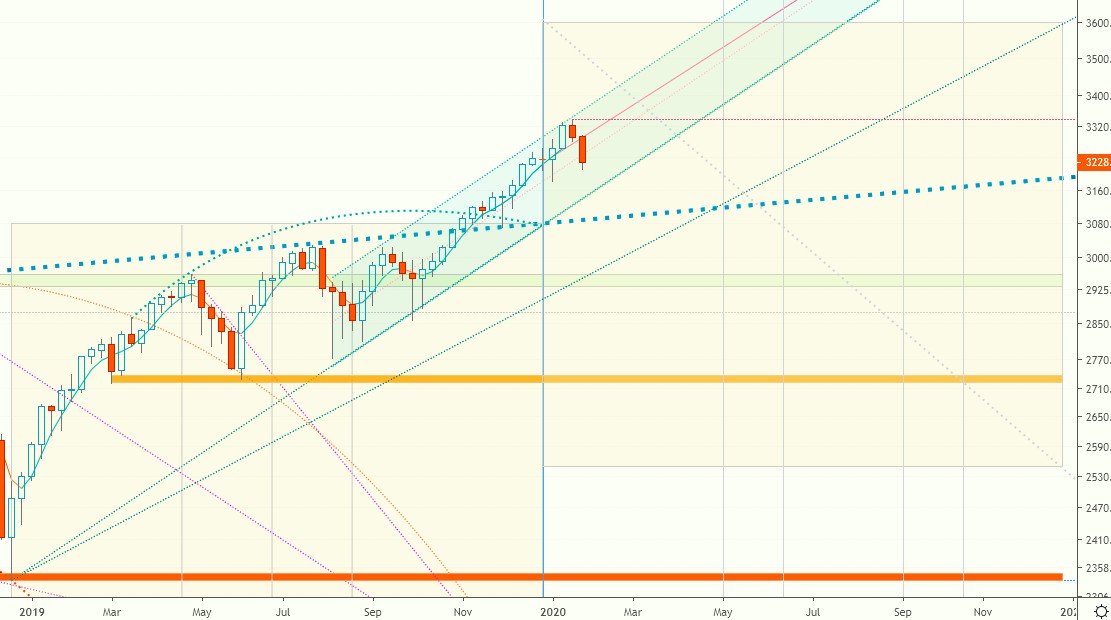
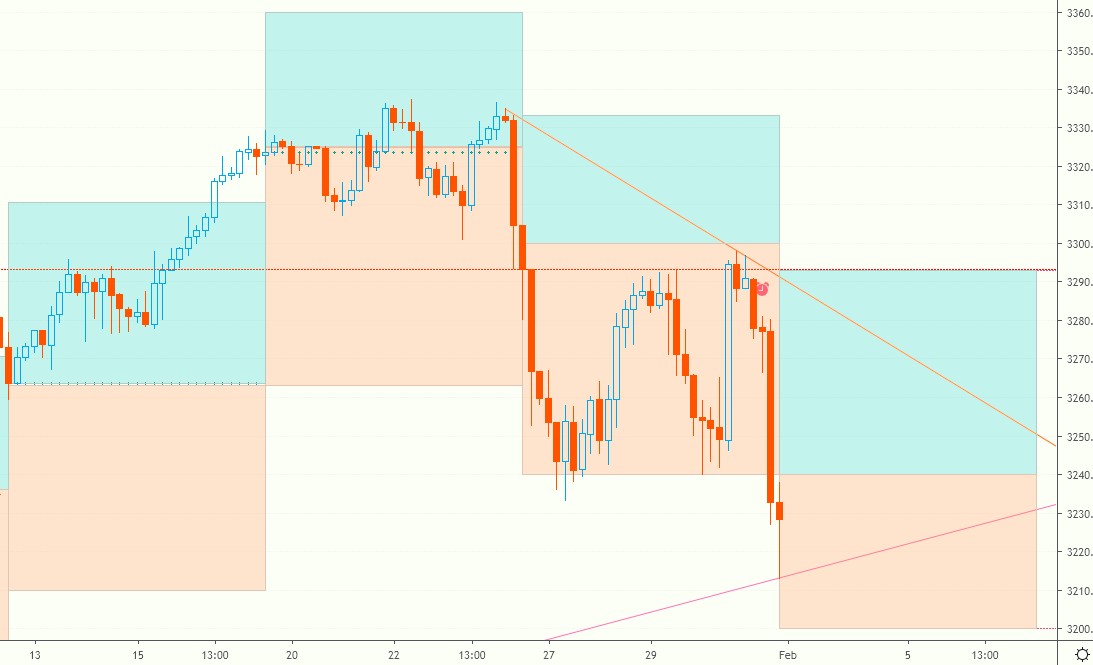
Switching to intra-week analysis, we note that the expected mid-week bounce came to pass, after the futures found support at the downside weekly target. The counter-trend rally, however, met resistance at the pivot line, couldn’t make it into the bullish zone, and reversed sharply lower. This is resulting in lower targets for next week:
Current signals: Daily Short, Weekly Short*
The projected trading range for the SPX is 3200 - 3293.
Next, we’ll revisit the intra-week action in Oil, Gold and the Euro, to highlight the practical applications of the newly introduced bull/bear zones.
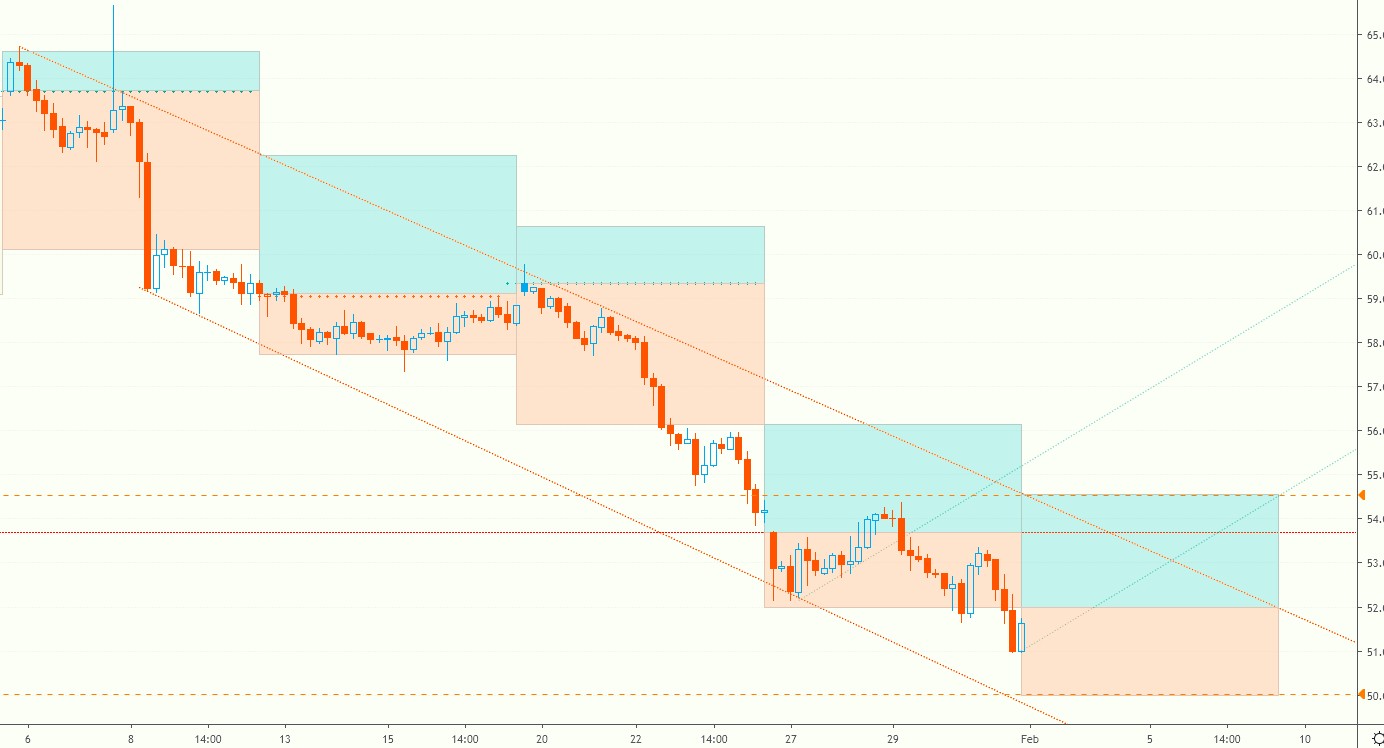
Oil found support at the lower weekly target, then briefly tested the bullish zone, before continuing to slide lower. Oil continues to print lower targets and remains on a sell signal.
The projected trading range for Oil is 50-54.55:
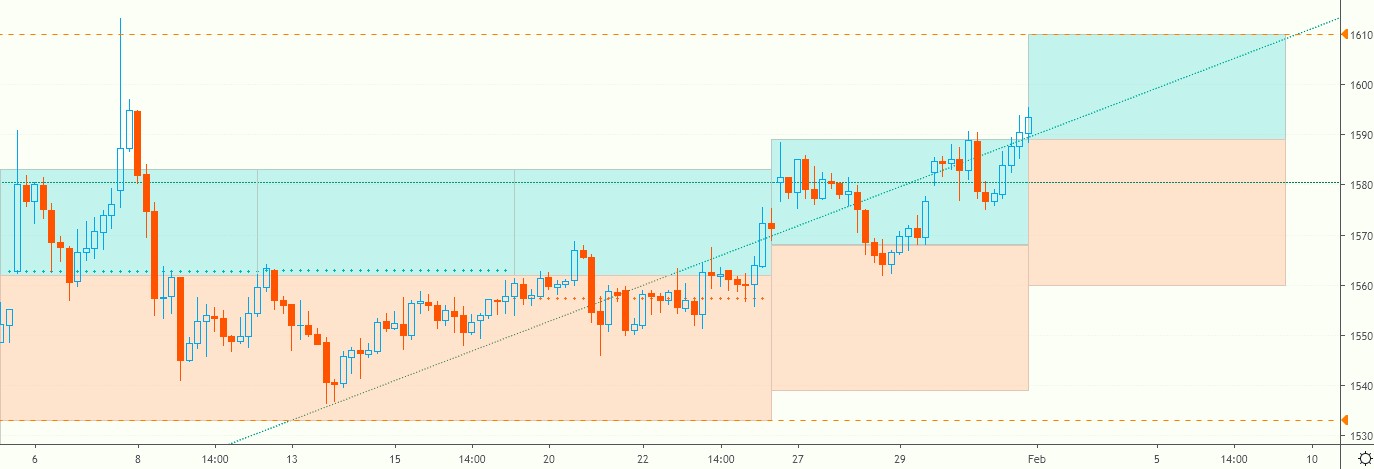
Gold was the mirror image of Oil. First, it met resistance at the upside weekly target, then found support around the bottom of the bullish zone, and finished the week just above the upside weekly target.
The projected trading range for Gold is 1560-1610:
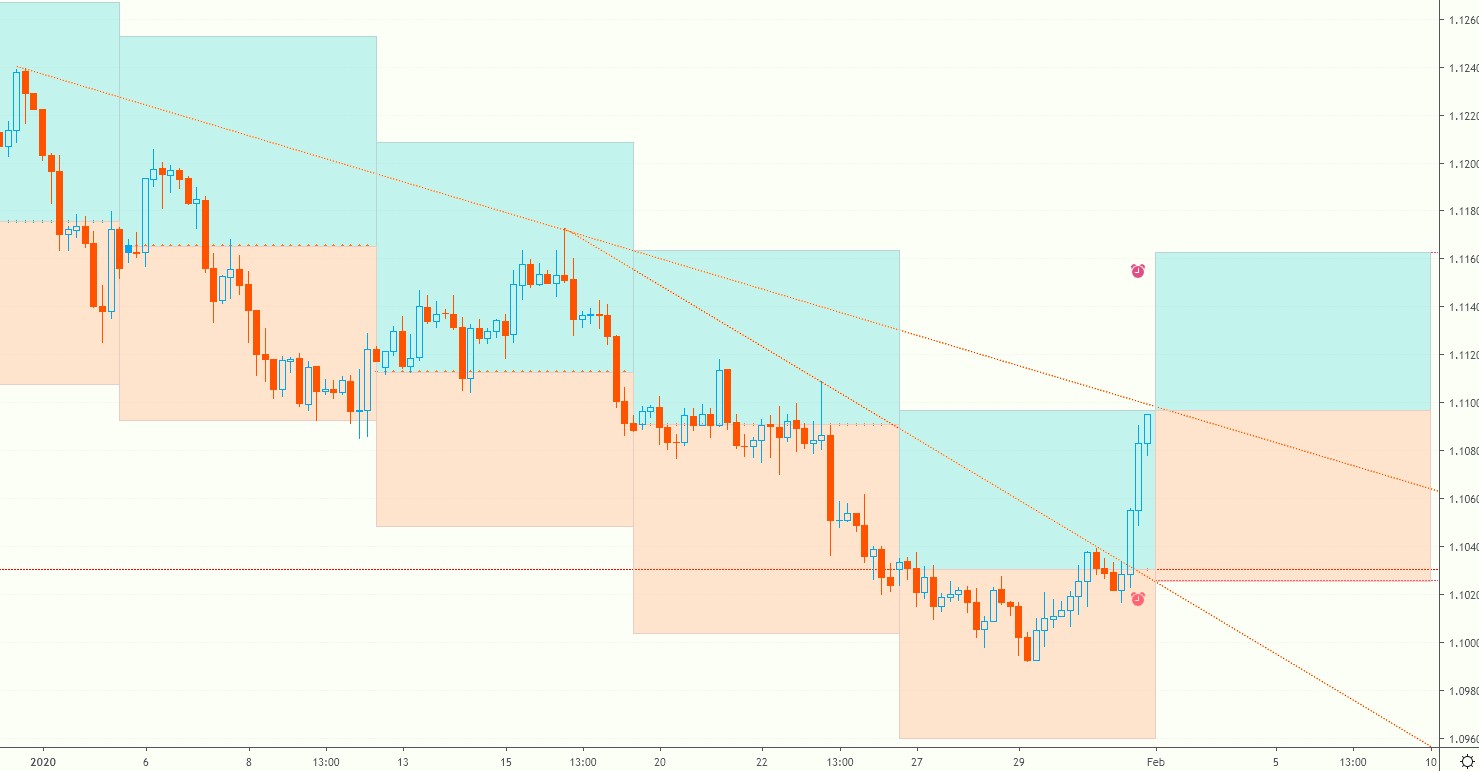
EURUSD spent most of the week inside the bearish zone, before exploding higher on Friday and reaching the upside weekly target. The close is just below the bearish trendline connecting the January highs. A break above could very well signal a change in trend for EURUSD.
The projected trading range for EURUSD is 1.10257-1.11628:
For more weekly targets and Buy/Sell pivots, check the TV page which gets updated on Monday.
*Please note that the signals are provided for informational purposes only. They are in effect as of the close on Friday and may change as soon as the markets re-open.
Charts, signals and data courtesy of OddsTrader, CIT for TradingView and NinjaTrader 8
For intraday charts and update follow us on TradingView
Disclaimer: Futures and forex trading contains substantial risk and is not for every investor. An investor could potentially lose all or more than the initial investment. Risk capital is money ...
more

