
South African Rand Forecast: USD/ZAR, GBP/ZAR,EUR/ZAR Price Setup
FUNDAMENTALS AND FEAR COLLIDE
Despite an increase in global risk sentiment and higher demand for Emerging Market currencies (EM), the downtrend pertaining to the South African Rand against major currency pairs has lost momentum, forming a penchant for mean reversion. This follows the discovery of a new variant of COVID-19, linked to South Africa, that has resulted in the implementation of travel bans by multiple nations on both the United Kingdom and South Africa, hindering hopes of a swift economic recovery, unless a vaccine can be rolled out on an international scale in the foreseeable future.
Meanwhile, fundamentals continue to be an additional driver of price action as Brexit negotiations and the US Stimulus package continue to get priced into the markets, with bulls and bears torn between fundamentals and fear.
USD/ZAR TECHNICAL ANALYSIS
USD/ZAR has continued to trade below the psychological level of 15.00 with price action stuck in a confluent zone between the descending trendline and level of support which has formed at 14.55. Although the Relative Strength Index (RSI) remains above 30, the pair continues to linger in oversold territory while trading well below the 55-period Exponential Moving Average.
If support is broken, selling pressure may resume into the new year, with bears eager to test January 2020 levels, when the pair traded at 13.923. On the contrary, an increase in demand for safe-haven currencies may result in US Dollar strength, driving price action above the trendline, with the 76.4% Fibonacci level providing resistance at 15.193.
USD/ZAR Daily Chart
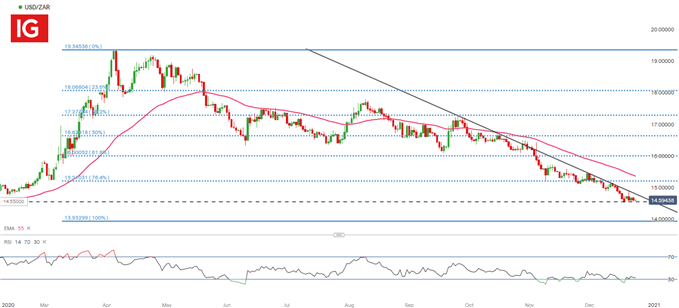
Chart prepared by Tammy Da Costa, IG
GBP/ZAR TECHNICAL ANALYSIS
After months of negotiations, talks of a post-Brexit trade deal boosted the demand for GBP against its major counterparts. However, gains were limited as the new travel bans and growing Covid-19 cases weighed on both Sterling and ZAR.
Currently, price action has halted at a key area of support at 19.645, formed by the 61.8% Fibonacci retracement level of the move between August 2019 low and April 2020 high. A break below this level may fuel selling pressure, with the next level of support forming at the psychological level of 19.00. If bulls are able to break above 20.00, increased buying pressure may assist in a test of the 50% retracement level, forming a wall of resistance at 20.437
GBP/ZAR Daily Chart
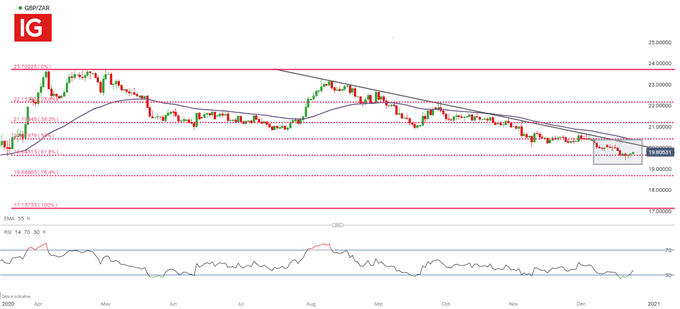
Chart prepared by Tammy Da Costa, IG
EUR/ZAR TECHNICAL ANALYSIS
The Euro has remained relatively flat as investors await the official announcement of a Brexit deal. Meanwhile, EUR/ZAR has made little headwind, with price action resembling that of the pairs discussed above.
Currently, the 61.8% Fibonacci retracement level holds as support at 17.675 with 17.50 forming as the next level of support. For bulls, a break above 18.00 could result in the 50% retracement level setting as the next level of resistance at 18.296.
EUR/ZAR Daily Chart
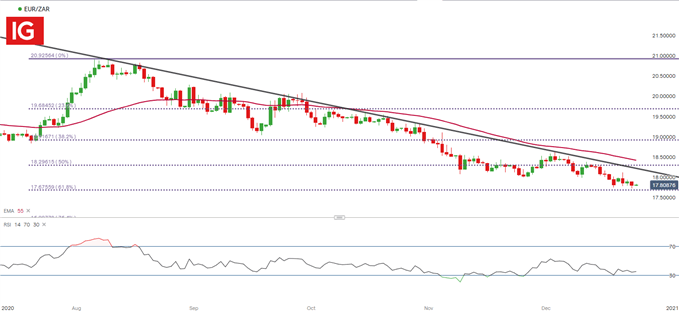
Chart prepared by Tammy Da Costa, IG
Disclosure: See the full disclosure for DailyFX here.


