
Short AUD/USD, AUD/JPY: Q2 Top Trading Opportunities
AUD/USD WEEKLY CHART
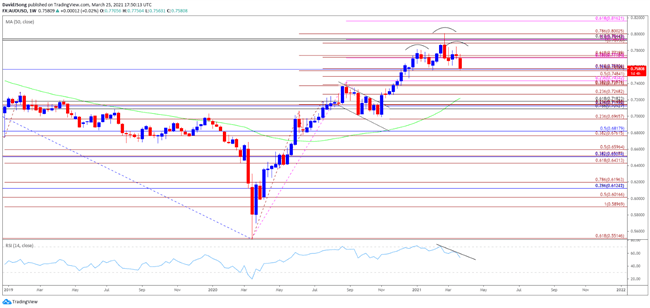
Chart prepared by David Song, created with Trading View
AUD/USD extended the V-shape recovery from 2020 to briefly trade above the 0.8000 handle in February, but a head-and-shoulders formation appears to be taking shape into the first quarter’s end. With the Relative Strength Index (RSI) exhibiting a similar dynamic as the indicator establishes a downward trend during the first quarter of 2021, traders should be mindful.
It remains to be seen if the decline from the February high (0.8007) will turn out to be a correction in the broader trend or a key reversal in market behavior. The 50-Week SMA (0.7220) continues to track a positive slope, but a break/close below the ‘neckline’ around 0.7560 (50% expansion) to 0.7580 (61.8% expansion) on a weekly timeframe would bring the downside targets onto the radar. The broader outlook for AUD/USD may align with the measured move for the head-and-shoulders pattern as long as the RSI retains the bearish trend from earlier this year. If so, the exchange rate may continue to narrow the gap with the 50-Week SMA (0.7220) if it pushes below the former resistance zone around 0.7370 (38.2% expansion) to 0.7390 (38.2% expansion).
AUD/JPY WEEKLY CHART
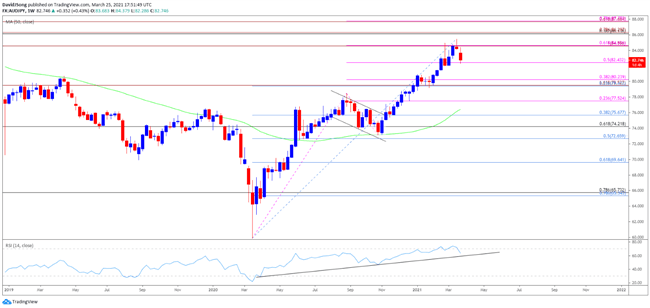
Chart prepared by David Song created withTrading View
AUD/JPY has also extended the V-shape recovery from 2020 amid the ongoing rise in global equity prices, with the RSI pushing above 70 for the first time since 2013 during the same period. The low interest environment may continue to prop up AUD/JPY as the 50-Week SMA (76.44) retains a positive slope, but recent developments in the RSI warn of a larger correction in the exchange rate as it falls back below 70 to indicate a textbook sell signal.
In turn, the RSI may continue to show the bullish momentum abating if it snaps the upward trend carried over from the previous year, with a close below the 82.40 (50% expansion) region. On a weekly timeframe, that brings a Fibonacci overlap around 79.40 (23.6% retracement) to 80.20 (38.2% expansion) onto the radar. However, the decline from the March high (85.45) may turn out to be a correction in the broader trend rather than a shift in AUD/JPY behavior as major central banks rely on their emergency tools to achieve their policy targets. Should that prove the case, there is potential for former resistance areas to act as support on the improvement in investor confidence.
Disclosure: See the full disclosure for DailyFX here.


