
Seasonal Trading Patterns For The World's Biggest Economies
The purpose of this article is to illustrate how most major stock exchanges have a seasonal pattern that one can trade based on the macro flow of funds from the national government and current account.
In this first installment, the top five economies of the world will be examined in order of largest to smallest in terms of GDP as shown in the chart below.
Other nations will follow in later articles.
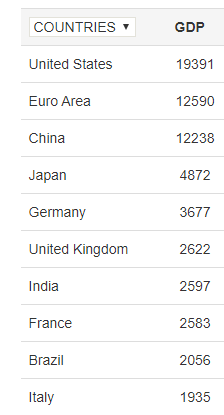
(Source: TradingEconomics.com)
United States
The following charts show the stock market set against the government budget and then the stock market set against the current account over five years.
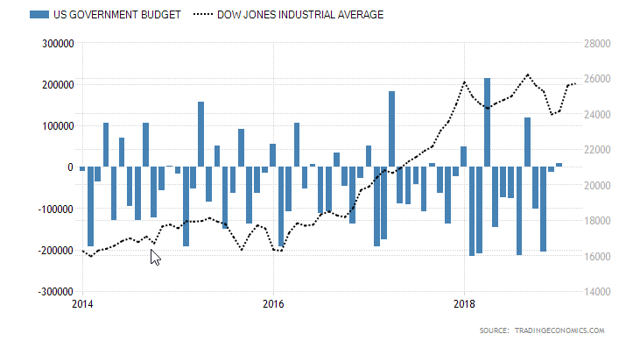
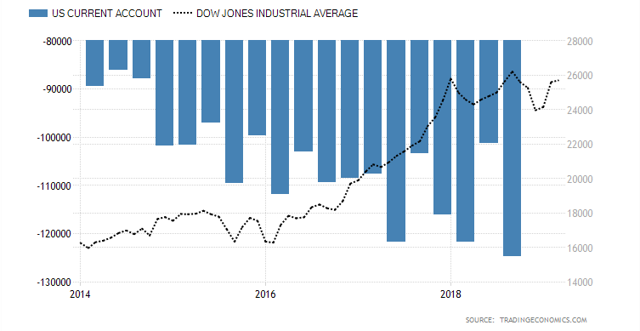
Total flows for the USA are about three to four percent of GDP for the government sector and two percent of GDP for the current account.
The national flows are greater in magnitude and more important than the external ones. Also, the current account deficit is effectively neutralized because export earnings are only allowed to be saved as US treasuries and not spent into asset markets such as for stocks, real estate or corporate bonds.
Settling the “balance” consisted of gold sales, until the United States finally was forced off gold in 1971. Since then, U.S. deficits have been settled by a run-up of Treasury debt to foreign central banks. For most other nations, the typical payments [IM]balance is foreign debt service, leading to a loss of international reserves (formerly gold, now mainly U.S. Treasury IOUs). The United States is almost alone in being able to settle its payments imbalances on military, trade and investment accounts in government IOUs denominated in its own fiat currency – U.S. Treasury bonds payable in dollars – without constraint
(Source: Hudson, Michael. J IS FOR JUNK ECONOMICS: A Guide To Reality In An Age Of Deception. ISLET/Verlag. Kindle Edition.)
The charts show that seasonally, the flow of funds from government peak in February/March and again in April and September.
A surplus budget month is always associated with a dip in the stock market or the end of a peak.
Deficit months, which are the norm, are associated with the end of a trough or the steady rise of the stock market.
Generally speaking, one can buy the stock market at the end of April and remain invested until early in the new year. The old adage "Sell in May and go away" should be changed to "buy in May and stay until December".
The current account is reported quarterly and so the data set is lumpy to say the least. Overall it is negative but less negative mid-year that at the end of the year. This is no doubt the agricultural harvest has an impact. There appears to be no seasonal stock market impact.
The dollars earned by nations exporting to the USA are effectively sterilized as foreign ownership of anything but US treasuries in largely not allowed.
The trading conclusion one can draw from this information is that one can buy the US stock market after the April dip with some reliability that it will rise afterward. This can be implemented via such ETFs as (SPY), (DIA), (QQQ).
China
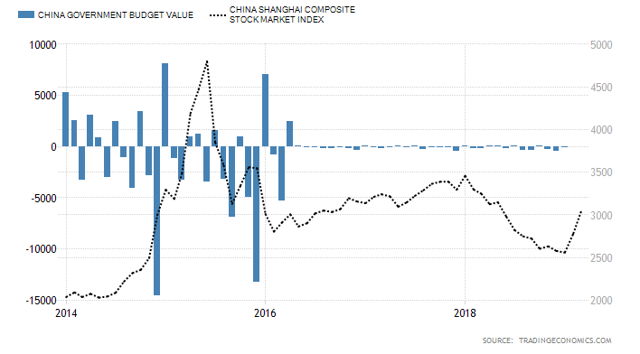
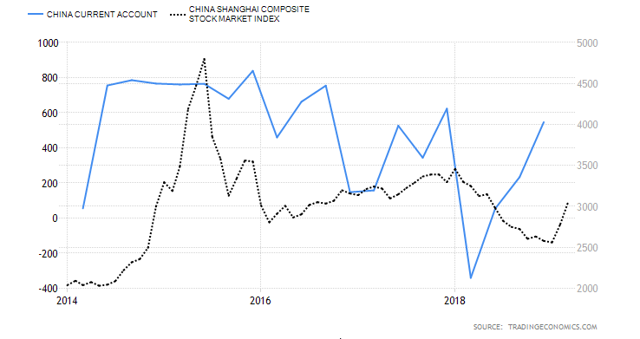
The flow of funds for China is about one percent for the current account and three percent or better for the government sector making a total of four percent of GDP positive cash flow.
Since 2016 the government sector has played a smaller role in the total flow of fund movements.
The Chinese government tends to spend December and then take it out again in January.
The current account has played a much larger role in the economy than now. In 2008, for example, it was more than ten percent of GDP.
There appears to be no definable seasonal tradeable pattern and one can note that since government spending and the current account have declined so has the stock market.
Japan
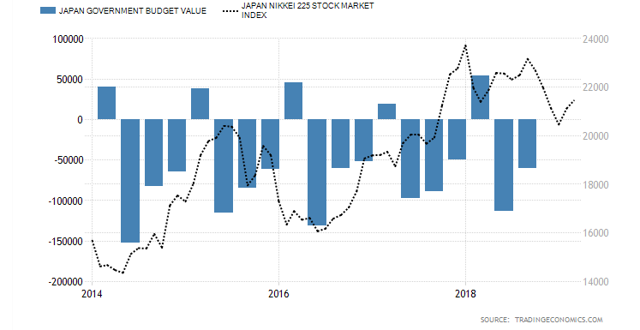
The flow of funds into the private domestic sector from government and from the current account are both positive and both are about four percent of GDP. That makes a combined total of over eight percent of GDP.
The impact of the flow of funds from the government to the stock market is noticeable. In the first quarter of each year, an extraction of funds is associated with a trough in the stock market or the end of a peak. The subsequent three deficit months see the stock market generally rise. The trouble is the flow of funds is reported quarterly, and not monthly, and so the lagged pre-warning effect is not as effective. National government flows in other countries have a lagged one-month knock-on effect on the stock market.
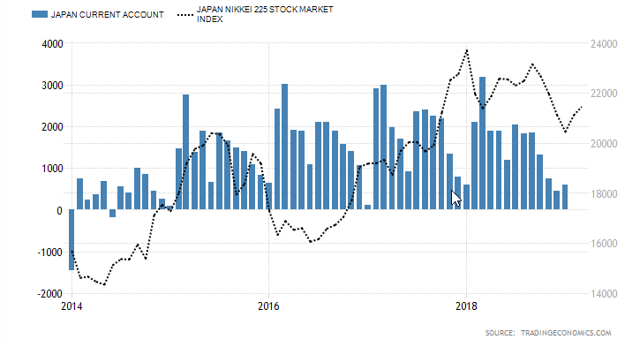
The current account tends to peak in the first quarter of the year and diminishes into the end of the year. This offsets somewhat the negative flow of funds from the national government in the first quarter.
The seasonal trade appears to be to buy after the stock market trough in the first quarter of the year and remain invested until the fourth quarter of each year and is a result of both funds flows working together. The central bank buying paper assets such as shares and corporate bonds is a big help too.
These ETFs are good for trading Japan.
(EWJ) iShares MSCI Japan ETF
(BBJP) JPMorgan BetaBuilders Japan ETF
(DXJ) WisdomTree Japan Hedged Equity Fund
(DFJ) WisdomTree Japan SmallCap Dividend
(HEWJ) iShares Currency Hedged MSCI Japan ETF
(DBJP) Xtrackers MSCI Japan Currency-Hedged Equity Fund
(FLJP) Franklin FTSE Japan ETF
(FJP) First Trust Japan AlphaDEX Fund
(SCJ) iShares MSCI Japan Small Cap ETF
(JPXN) iShares JPX-Nikkei 400 ETF
(DXJS) WisdomTree Japan Hedged SmallCap Equity Fund
(JPN) Xtrackers Japan JPX-Nikkei 400 Equity ETF
(JPMV) iShares Edge MSCI Min Vol Japan ETF
(GSJY) Goldman Sachs ActiveBeta Japan Equity ETF
(FLJH) Franklin FTSE Japan Hedged ETF
(DXJF) WisdomTree Japan Hedged Financials Fund
(JHDG) WisdomTree Japan Hedged Dividend Growth Fund
(DEWJ) iShares Adaptive Currency Hedged MSCI Japan ETF
(HJPX) iShares Currency Hedged JPX-Nikkei 400 ETF
Germany
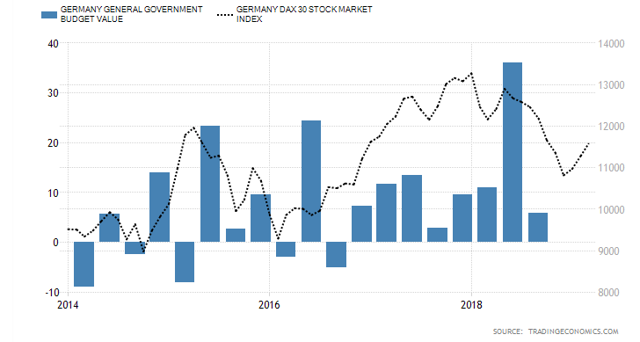
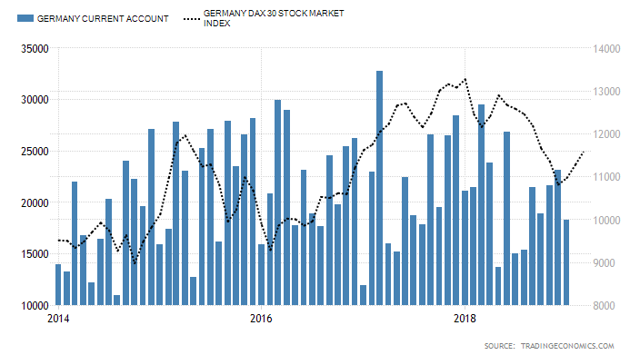
The government budget deficit/surplus is only one percent of GDP and plays a small role in fiscal patterns. The surplus budgets are a small negative force in the economy and markets.
The stock market tends to rise and fall with the current account with a one month lag. This is understandable given that the current account is eight percent of GDP or better.
A good current account result could be bought for an expected rise of the stock market into the next month and vice versa.
These ETFs are good for trading Germany.
(EWG) iShares MSCI Germany ETF
(HEWG) iShares Currency Hedged MSCI Germany ETF
(FGM) First Trust Germany AlphaDEX Fund
(DXGE) WisdomTree Germany Hedged Equity Fund
(EWGS) iShares MSCI Germany Small-Cap ETF
(DBGR) Xtrackers MSCI Germany Hedged Equity Fund
(DAX) Global X DAX Germany ETF
(FLGR) Franklin FTSE Germany ETF
(GRMY) Xtrackers Germany Equity ETF
United Kingdom
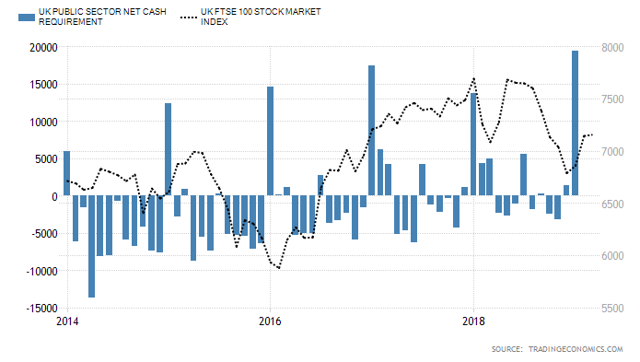
The UK flow of funds is similar to Germany in that the government contribution is only one to two percent of GDP whereas the current account is four to five percent of GDP.
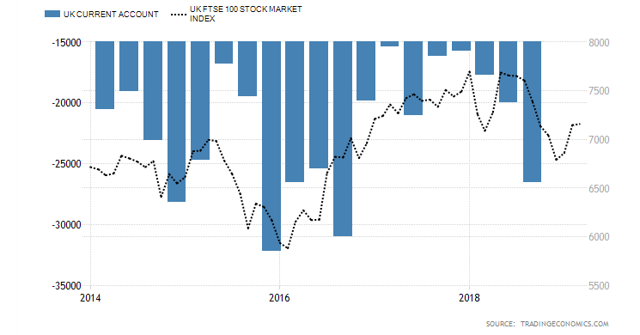
One sees from the current account chart above that the larger the deficit, the lower the stock market falls, and vice versa. A small current account deficit is associated with a higher stock market with a one-quarter lag. When one sees a good current account result one could expect the stock market to rise into the subsequent quarter and vice versa. The quarterly current account data reporting nullifies to some extent the pre-warning lagged effect on the stock market. A one-month reporting interval would be more helpful for trading.
The EFTs are good for trading the UK.
(EWU) iShares MSCI United Kingdom ETF
(EWUS) iShares MSCI United Kingdom Small-Cap ETF
(WBIA) WBI Bull|Bear Rising Income 2000 ETF
(FLGB) Franklin FTSE United Kingdom ETF
(HEWU) iShares Currency Hedged MSCI United Kingdom ETF
(FKU) First Trust United Kingdom AlphaDEX Fund
(DBUK) X-trackers MSCI United Kingdom Hedged Equity Fund
Conclusion
In the next installment of this series, we will have a look at India, France, Brazil, and Italy to round out the examination of seasonal stock market trading patterns based on an examination of the macro flow of funds from government and the external sector into the private domestic sector.
From this article, one can see that there are usable seasonal trading patterns based on the macro flow of funds for the USA, Japan, and Germany and while distinguishable patterns do exist for the UK the reporting interval for the current account does not provide a lagged warning effect.


This is an example of the post hoc ergo prompter hoc fallacy. it's not that simple
which of course is a shame. Moreover the funds listed may not be the best way to get the trend for the foreign market in question. There are more than fund flows within the country which account for market moves, alas.
Thank you for reading and commenting. I disagree. It is an example of applied sectoral flow analysis where flows of income cause a change in the stock of assets. It uses national accounting to track the flows at the macro level, a thing that on one does nut that was discovered by Professor Wynne Godley and the Post Keynesian school of economics. It has been out of favour for the last 50 years or so as it runs counter to current neoliberal economic thinking. It is taught though at the Levy Institute Bard College.
So what would you recommend?
Cool idea.
Fascinating.
Thank you for reading and commenting.
Impressive, it looks like you put a lot of work into putting this together. Thank you for sharing.
Thank you. It is more a summary of the findings from more detailed articles on each country that I have been doing for some years.
Where can I find them? Hope to continue reading your work...
seekingalpha.com/.../alan-longbon#regular_articles
Thanks, but I'm not a fan of Seeking Alpha. I used to be but a lot of the content has gone downhill. And there's simply too much "fake news" on that site: www.zerohedge.com/.../sec-cracks-down-fake-news-pump-and-dumps-targets-seeking-alpha-benzinga
I'm too old to waste time there. But glad it works for you.
I agree with you and there are about 3 authors there that I follow and the rest I do not. I will be writing here more now that I have discovered it. Here my articles get a lot more page views that weeks at SA.