
Recession May Hit New Zealand In 2017; But At A Five-Year Horizon, Real Economic Growth Is About 2% Per Year
In 2010, we published a paper in the Journal of Applied Economic Sciences, which predicted real GDP per capita, rGDPpc, in several developed countries. Corresponding working paper was published in 2009 and covered the period before 2007. The evolution of rGDPpc in New Zealand was also presented in this blog in 2011.
Here, we revisit the 2010 model for New Zealand. It is important to stress that all defining parameters, which were estimated by the LSQ method from the data before 2008, are retained in the revisited model. Therefore, this is an out-of-sample test. The test result shows that our model accurately predicts the evolution of real GRP in New Zealand at an 8-year horizon. As predicted in 2009, in the next few years the growth rate will be increasing, except a deep fall in 2017, as we also expect in the USA. Since the full prediction horizon is 14 years, we will be reporting on the model prediction in the future, but not often – the change in real economic growth is a slow process.
The original macroeconomic model for real GDP growth in developed countries was formulated in 2006 in the paper “GDP growth rate and population” published in the ECINEQ WPS. The model links the rate of growth in rGDPpc, g(t) = dln(rGDPpc)/dt, with the attained level of the rGDPpc and the rate of growth in population of a country-specific age.
g(t) = dln rGDPp(t)/dt = A/rGDPpc(t) + 0.5dlnNs(t)/dt (1)
where empirical constant A and the specific age, Ns, are estimated from data. To obtain the model parameters, we used rGDPpc time series borrowed from the Total Economy Database. The best fit annual increment value is A=$420 (notice that we used the EKS US$, as published by the Conference Board in 2016, while the GK 1990US$ were used before). The term A/rGDPpc(t) corresponds to inertial economic growth, which is observed when there is no change in the Ns. The specific age population in New Zealand is 14 years, as in the previous versions. To describe the change in Ns, we used the age pyramid obtained in the 2006 census and extrapolated it in the past and in the future. The precision of Ns predictions decreases with the difference between the predicted year and 2006. We do not use fresher censuses because the goal of this study is to prove the model and to assess the accuracy of prediction at various time horizons. The largest time horizon for the 2006 census is 2021.
Figure 1 presents the observed and predicted GDP growth rates for New Zealand as obtained in 2008. Both curves are characterized by high-amplitude oscillations likely associated with measurement errors. Therefore, in Figure 2 we present both annual curves smoothed with MA(5) and MA(3), respectively. One can conclude that our prediction from 2008 was correct and real GDP per capita in New Zealand follows the predicted curve. This is the best validation of our model for NZ and the driving force of real economic growth in developed countries.
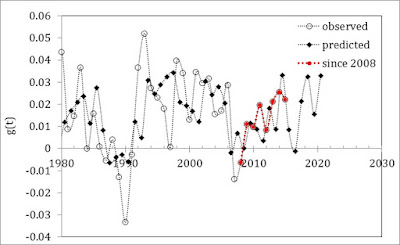
Figure 1. Observed and predicted growth rate of real GDP per capita in New Zealand between 1980 and 2015.
Figure 2. The observed curve in Figure 1 is smoothed with a five-year moving average. The predicted rate is smoothed with MA(3). One can observe an outstanding accuracy of GDP prediction for 2009 and 2015 (between the smoothed curves).
Disclosure: None.


