
Performance Characteristics Of The S&P/B3 Low Volatility High Dividend Index
After exploring the rationale behind the implementation of a low volatility high dividend strategy in Brazil in our previous blog, we will now examine the recently launched S&P/B3 Low Volatility High Dividend Index.
The index is designed to measure the performance of the least volatile stocks among a specified group of high-dividend-yielding constituents from its benchmark, the S&P Brazil BMI, and is subject to diversification and tradability requirements. The constituents are weighted by their trailing 12-month dividend yield. To accommodate trading capacity, the maximum weight is capped at the lower of 15% and five times its liquidity weight.[1]
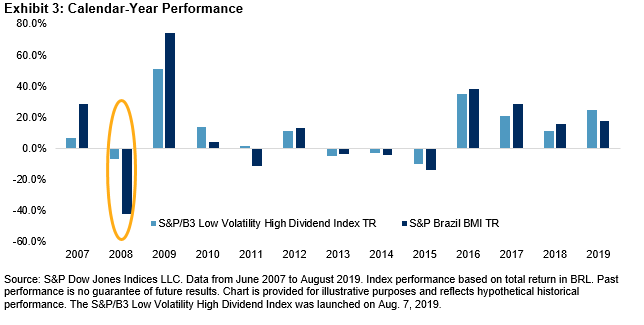
Historically, the S&P/B3 Low Volatility High Dividend Index exhibited better risk/return characteristics than the benchmark, especially over the mid- and long-term periods. In investment horizons longer than five years, the index outperformed the benchmark on an absolute and risk-adjusted basis. In the 12-year back-tested period ending in August 2019, the strategy exhibited a significantly lower maximum drawdown (-26.9%) compared with the S&P Brazil BMI (-49.5%; see Exhibit 1).
(Click on image to enlarge)

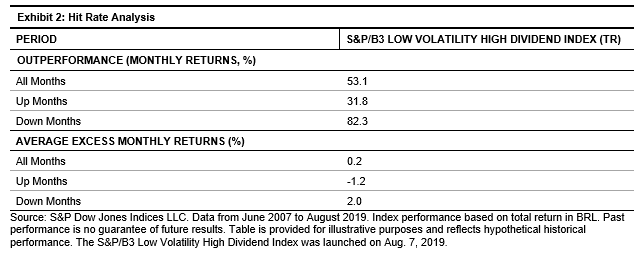
The S&P/B3 Low Volatility High Dividend Index provided downside protection in periods of market turbulence. During all the months in which the benchmark was down between June 2007 and August 2019, the S&P/B3 Low Volatility High Dividend Index outperformed 82.3% of the time and generated a monthly average excess return of 2% over the benchmark. [2] This defensive characteristic is typical of a low volatility strategy (see Exhibit 2).
(Click on image to enlarge)
(Click on image to enlarge)
(Click on image to enlarge)
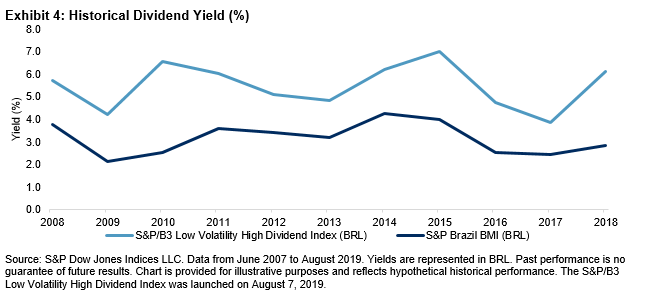
The S&P/B3 Low Volatility High Dividend Index was also able to generate higher yield than the S&P Brazil BMI. Over the studied period, the S&P/B3 Low Volatility High Dividend Index had an average historical yield of 5.5%, compared with 3.1% for the benchmark.
We will explore more about dividend strategies in Brazil in our next blog.
[1] Liquidity weight is measured as a security’s six-month median daily value traded.
[2] Up months are defined as periods when the S&P Brazil BMI had a positive monthly return. Down months are defined as periods when the S&P Brazil BMI had a negative monthly return.
Copyright © 2018 S&P Dow Jones Indices LLC, a division of S&P Global. All rights reserved. This material is reproduced with the prior written consent of S&P DJI. For more information ...
more

