
Oil Price Outlook Mired By Sticky US Crude Output
CRUDE OIL PRICE TALKING POINTS
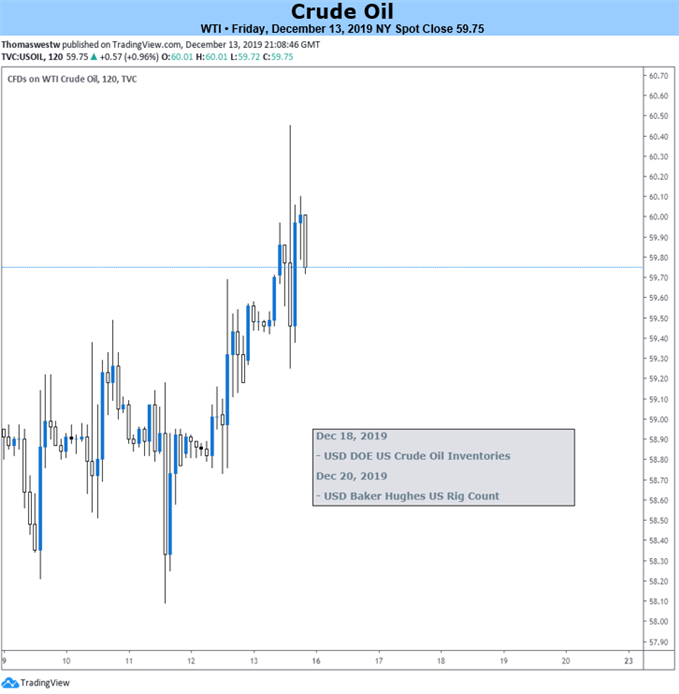
The price of oil preserves the advance following the Organization of the Petroleum Exporting Countries (OPEC) meeting as the US and China, the two largest consumers of crude, reach a trade agreement.
FUNDAMENTAL FORECAST FOR CRUDE OIL: NEUTRAL
The price of oil traded near the monthly high ($59.85) as China averts the next wave of US tariffs, and the new measures announced by OPEC and its allies may keep crude prices afloat as the group plans to reduce production by another 500K b/d starting in January.
The efforts should help to generate higher energy prices as OPEC expects global consumption to increase by 1.08 mb/d in 2020, led by China.
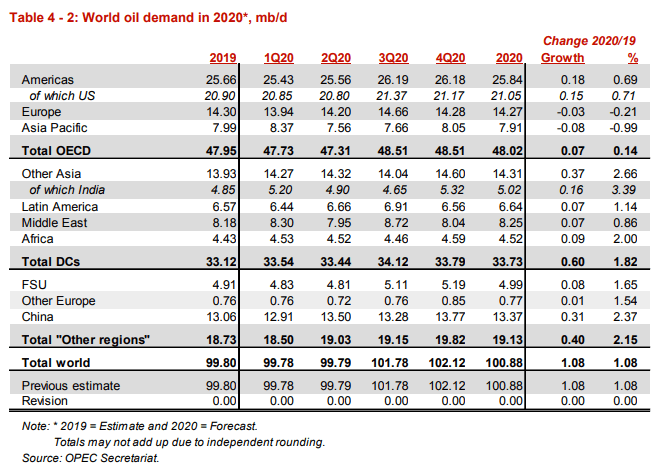
The Monthly Oil Market Report (MOMR) points to higher consumption in 2020 as global demand is expected to increase to 100.88 mb/d from 99.80 mb/d in 2019. However, signs of growing consumption may do little to derail the commitment to the ‘Declaration of Cooperation’ (DoC) as U.A.E. Energy Minister Suhail Mohammed Al Mazrouei insists that “OPEC and OPEC+ members will be satisfied with a price ranging between $60 and $70 per barrel or even $80.”
In fact, OPEC and its allies may regulate the energy markets throughout 2020 as the International Energy Agency (IEA) warns that “global oil inventories could build by 0.7 mb/d in 1Q20” as US crude output sits near the record high.
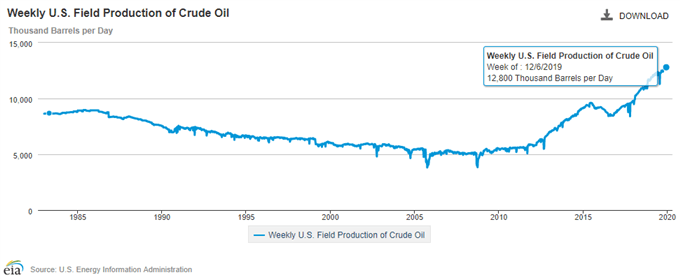
Updates from the US Energy Information Administration (EIA) showed weekly field production of crude narrowing to 12,800K in the week ending December 6 after holding at 12,900K for two straight weeks.
It remains to be seen if OPEC and its allies will announce additional measures at next meeting starting on March 5 amid the ongoing expansion in US crude output, but the ‘Declaration of Cooperation’ may continue to ward off a bear market as the group emphasizes the “vital support and commitment of all participating countries in the DoC to build on the success achieved thus far.”
In turn, the price of oil may largely track the range bound price action from the third quarter of 2019 as OPEC and its allies continue to regulate the energy market.
OIL DAILY CHART
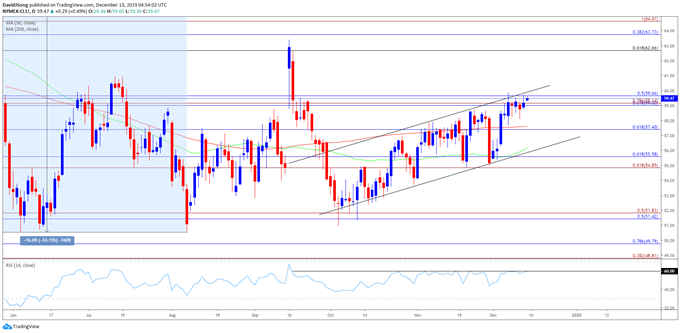
Source: Trading View
Crude oil appears to be tracking the price action from the third-quarter, with flattening slopes in the 50-Day ($55.19) and 200-Day SMA ($57.61) indicative of range-bound conditions.
The string of failed attempts to break/close above the Fibonacci overlap around $59.00 (61.8% retracement) to $59.70 (50% retracement) raises the scope for a near-term pullback in the price of oil, with recent developments in the Relative Strength Index (RSI) providing a similar signal as theoscillator appears to be capped around the 60.
Lack of momentum to break/close above the Fibonacci overlap around $59.00 (61.8% retracement) to $59.70 (50% retracement) may spur a move towards $57.40 (61.8% retracement), wit the next area of interest coming in around $54.90 (61.8% expansion) to $55.60 (61.8% retracement), which largely lines up with the December low ($55.35).
Disclosure: Sign up and join DailyFX Currency Strategist David Song LIVE for an ...
more

