
Mexican Peso Price Forecast: USD/MXN Breakout To Fibonacci Resistance
It’s been a strange year so far for emerging market currencies. Despite the continued strength of the global risk trade, pushed along by the hope for continued stimulus to soften the covid crunch seen globally, EM currencies have been incredibly weak as the US Dollar has shown a surprising two-month stretch of strength.
In USD/MXN, the pair came into the year with two different falling wedge formations, which I had written about two months ago: One very visible on shorter-term charts while the longer-term formation had built for the final eight months of 2020 trade. The shorter-term formation is shown below in green, while the longer-term formation is highlighted in red.
USD/MXN DAILY PRICE CHART: FALLING WEDGES FALLING INTO PLACE
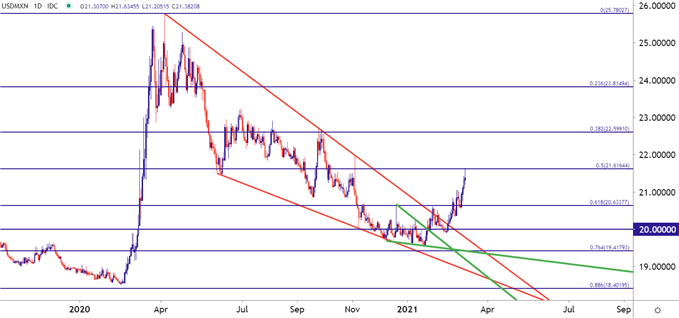
Chart prepared by James Stanley; USDMXN on Tradingview
FALLING WEDGE BREAKOUTS IN FULL VIEW
Given the juxtaposition of USD/MXN coming into 2021, in which a falling wedge had built inside of another longer-term falling wedge, it’s of little surprise that the pair has broken out as aggressively as it has.
Falling wedges will often be approached with the aim of bullish reversals – hypothesizing that the same lack of enthusiasm from sellers at or near lows will eventually carry-over to allow for a reversal in the bearish trend.
Those breakouts have run very loudly so far in the 2021 trade, and USD/MXN has stretched up for a test of Fibonacci resistance at the level around 21.6164. This is the 50% marker of the 2017-2020 major move in the pair, and this is a key area for bulls to overtake if this trend is going to become something more than a bear market bounce.
The 50% marker can be a key level in a Fibonacci retracement, despite the fact that it’s not technically a Fibonacci level at all. To learn more, check out the recently launched Fibonacci sub-module inside of DailyFX Education
USD/MXN WEEKLY PRICE CHART
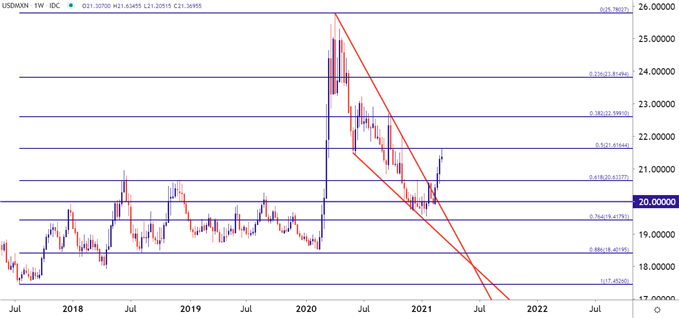
Chart prepared by James Stanley; USDMXN on Tradingview
USD/MXN STRATEGY NEAR-TERM
At this point, the counter-trend move to the longer-term theme remains in-force, with the potential for that longer-term theme of USD/MXN weakness to come back should this resistance level hold.
Going down to the two-hour chart offers some greater granularity and at this point, there’s little evidence to suggest that the bullish trend is yet over. There’s been a sequential print of higher-highs and higher-lows and, even after the resistance inflection has shown, that pattern has yet to breach.
But – from the shorter-term charts traders can begin to watch for this theme, looking for sellers to push price action below these higher-lows to open the door for deeper reversal potential.
USD/MXN TWO-HOUR PRICE CHART
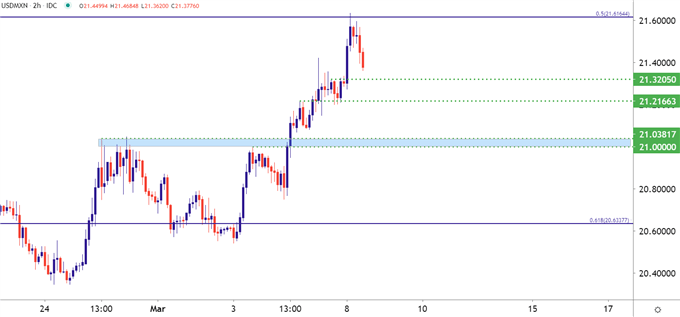
Chart prepared by James Stanley; USDMXN on Tradingview
Disclosure: See the full disclosure for DailyFX here.


