
Mexican Peso Forecast At Inflection Point - Levels For MXN/JPY, USD/MXN
MEXICAN PESO HAMPERED BY RISING YIELDS
It’s been a tough few weeks for EM FX. Rising global bond yields, but US Treasury yields, in particular, have forced a wave of asset reallocation, creating churn within FX markets as well. But the worst may be behind the Mexican Peso.
More US fiscal stimulus is good news for risk appetite broadly, and a better than expected US labor market report for February has shifted the narrative from ‘inflation’ to ‘reflation,’ which tends to be beneficial for growth-linked assets. USD/MXN rates may be ripe for a reversal, while MXN/JPY rates could find their footing and shake off what’s been trendless trading thus far in 2021.
MEXICAN PESO ECONOMIC CALENDAR - REST OF WEEK
Peso traders have already seen the major event come down the pipeline for the week, with the release of the February Mexican inflation rate (CPI) earlier today. With both headline and core measures beating each of the forecast and prior readings, speculation that Banxico may be looking at a rate cut at its March 25 meeting may fade; after all, it was the 25-bps rate cut in February that helped precipitate some of the MXN weakness. On Friday, the January Mexican industrial production report is due and likely to provoke some volatility in the pair, which could pose an obstacle at the end of the week.
USD/MXN RATE TECHNICAL ANALYSIS: DAILY CHART (FEBRUARY 2020 TO MARCH 2021) (CHART 1)
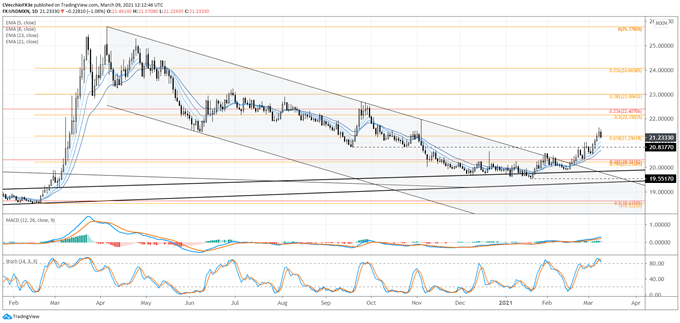
USD/MXN rates broke the downtrend from the April and September 2020 highs in mid-February, and have since then been on a steady drift higher. But USD/MXN rates have reached the crucial 61.8% Fibonacci retracement of the 2020 low/high range at 21.2942, which is an important reason for pause: this particular retracement level represents a potential inflection point. By returning above the 61.8% retracement, USD/MXN rates would shift from a neutral perspective to a bullish perspective.
However, USD/MXN rates are attempting a classic turnaround Tuesday, with a bearish piercing candle forming on the daily chart. The fight to shift momentum has begun, as the profile remains rather bullish. USD/MXN rates are still above their daily 5-, 8-, 13-, and 21-EMA, which is still in bullish sequential order. Daily MACD is trending higher and still above its signal line, while Slow Stochastics are turning lower, yet remain in overbought territory. A drop through the daily 5-EMA would be the first sign a turn has arrived.
MXN/JPY RATE TECHNICAL ANALYSIS: DAILY CHART (JANUARY 2020 TO MARCH 2021) (CHART 2)
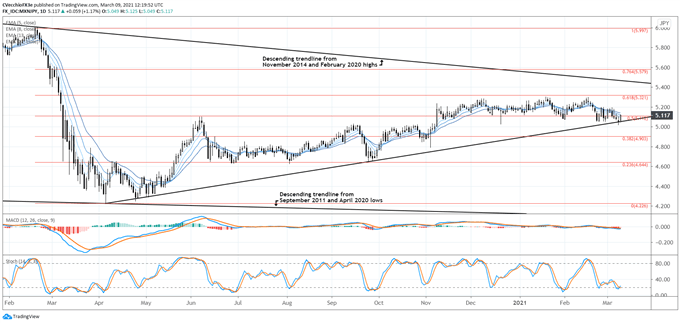
MXN/JPY rates have been slowly eroding through 2021, but trading has been rather listless. The EM FX selloff coupled with the Banxico rate cut pressured the pair lower, but rising global bond yields have sapped demand for the Japanese Yen. While the pair is not in any different position than it was at the start of this month or last, trading is a function of price and time, and the passage of time has seen MXN/JPY arrive at the rising trendline from the April and September 2020 lows – its pandemic uptrend.
The initial rebound at trendline support arrives concurrently with the 50% Fibonacci retracement of the 2020 high/low range at 5.112. A break above the daily 21-EMA would signal greater potential for a return to the March high around 5.200.
USING A PROXY TO TRACK USD/MXN RETAIL POSITIONING
With respect to the difference in performance between USD/CAD and USD/MXN rates in recent weeks, it should be noted that the Canadian economy is more independent from the US economy than is the Mexican economy. While the United States is both countries’ largest trading partner, over 80% of Mexico’s exports go to the United States (compared to near 70% for Canada), while 30% of Mexico’s GDP is derived from economic activities involving the United States (compared to 20% for Canada).
The close proximity of both countries given their trade relationship with the United States also means that their currencies tend to trade in a similar fashion as well. In other words, there is a reasonable basis of expectation for USD/CAD and USD/MXN rates to trade in a similar fashion.
Yet the combination of higher energy prices and higher US Treasury yields has provoked a decoupling between USD/CAD and USD/MXN in the near-term. At present, the 5-day correlation between the pairs is currently -0.12 while the 20-day correlation is -0.18. One week ago, on March 2, the 5-day correlation was +0.76 and the 20-day correlation was -0.33.
IG CLIENT SENTIMENT INDEX: USD/CAD RATE FORECAST (MARCH 9, 2021) (CHART 3)
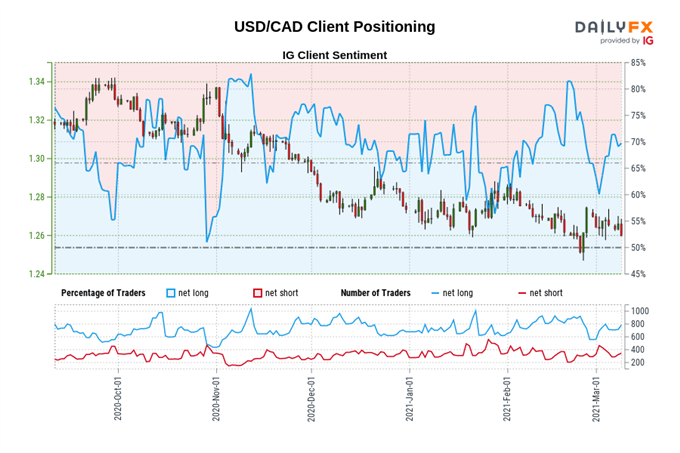
USD/CAD: Retail trader data shows 67.93% of traders are net-long with the ratio of traders long to short at 2.12 to 1. The number of traders net-long is 3.33% lower than yesterday and 3.29% higher from last week, while the number of traders net-short is 5.33% higher than yesterday and 17.40% lower from last week.
We typically take a contrarian view to crowd sentiment, and the fact traders are net-long suggests USD/CAD prices may continue to fall.
Positioning is less net-long than yesterday but more net-long from last week. The combination of current sentiment and recent changes gives us a further mixed USD/CAD trading bias.


