
Long USD/ZAR: Top Trade Opportunities

Image Source: Unsplash
Long USD/ZAR: Aggressive Fed Marking the End of the Road for Resilient Rand?
After a strong Q1 in 2022 for the rand (which has been the trend over the past few years), it could be in for a turnaround. Before delving into potential Q2 influences, it is important to remind ourselves of the factors behind the rand’s recent support:
- War in Ukraine driving supply concerns.
- Higher commodity prices (in particular rand-linked exports such as iron ore, gold, platinum, and coal).
- China’s relative resistance to geopolitical tensions in Europe – primary trading partner with South Africa.
- A subdued Fed.
These four major factors will remain key influences going into Q2, along with some likely changes which may skew forecasts in favor of the dollar. The first and most important in my opinion is the Fed’s pivot to a more hawkish stance. Fed Chair Jerome Powell has opened up the possibility for 50 bps hikes going forward while money markets have been recently pricing in roughly 250 bps of Fed tightening for 2022.
Whether the US economy can handle tightening of this severity is another question altogether, but what we can deduce is that the Fed and SARB’s rate hike path will differ drastically. In addition, it can be said with certainty that the South African economy cannot cope with such drastic tightening measures.
The graphic below shows the current approach from the two central banks. With current expectations, we are likely to see the Fed funds target rate (red) steepen far quicker than the South African repo rate. In addition, the USD/ZAR pair tends to trend higher in Q2 (historically speaking), and this may well unfold in Q2 2022.
USD/ZAR vs. US & South African Interest Rates (2012 - Present)
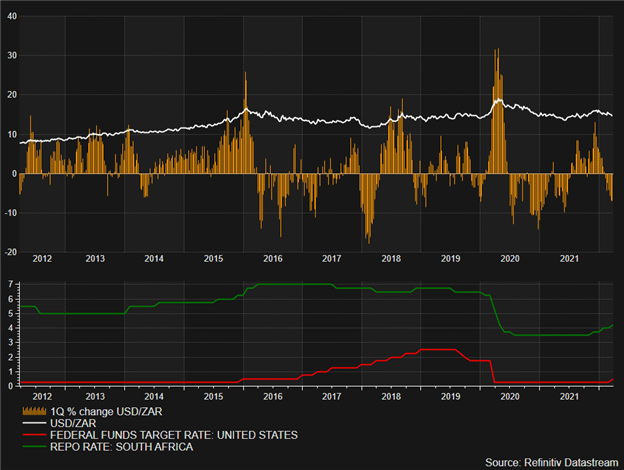
Chart prepared by Warren Venketas, Refinitiv
China’s bearing on the rand is significant, but with the implementation of strict lockdowns due to the spread of COVID-19, demand from China may decline, leaving the rand open to further downside – limiting commodity gains.
USD/ZAR Weekly Chart
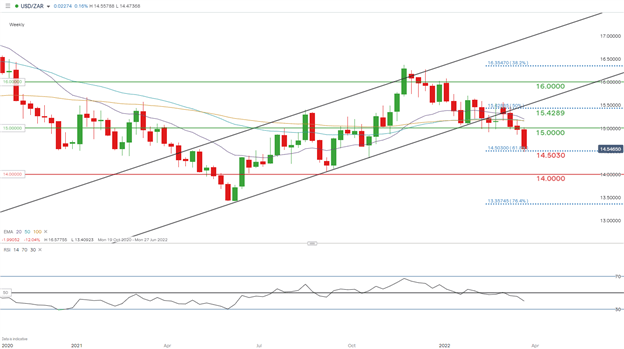
Chart prepared by Warren Venketas, IG
The weekly USD/ZAR chart shows price action trading below the key 15.0000 psychological support level for the first time since late 2021, slumping to yearly lows around the 14.5030 38.2% Fibonacci support level – taken from February 2018 lows to April 2020 highs. While there is still room for short-term rand strength, I anticipate a rebound from the dollar opening up room to push higher towards the 15.0000 handle once more.
Key resistance levels:
- 15.4289.
- EMA’s (20, 50, and 100-day).
- 15.0000.
Key support levels:
- 14.5030.
- 14.0000.
Disclosure: See the full disclosure for DailyFX here.


