
Light Crude Oil Breakout Imminent
Senator Lindsey Graham unleashed a series of tweets Saturday morning after learning of drone attacks on Saudi oil refineries.
I've yet to hear whether the Saudis will blame/have blamed Iran for the attacks and whether war will eventually be declared.
Iranian supported Houthi rebels who attacked Saudi oil refineries is yet another example of how Iran is wreaking havoc in the Middle East. The Iranian regime is not interested in peace - they’re pursuing nuclear weapons and regional dominance. https://t.co/RElvTDFYb2
— Lindsey Graham (@LindseyGrahamSC) September 14, 2019
No doubt, this will affect oil prices when futures trading begins later on Sunday.
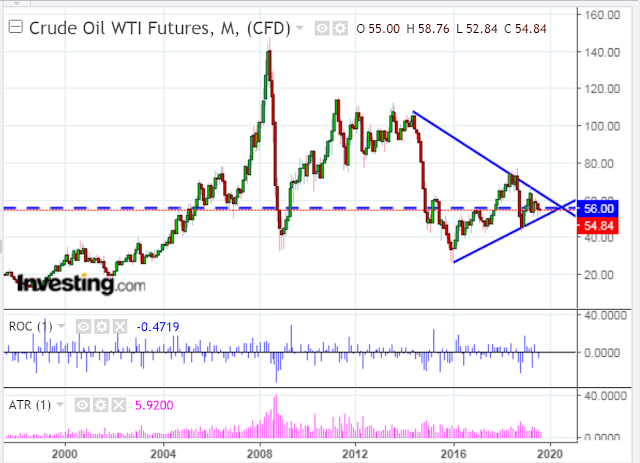
Light Crude Oil futures closed on Friday at 54.84. As shown on the following monthly chart of CL, it's sitting just below the apex (at 56.00) of a large triangle and is about to breakout of this formation soon.
Saturday's news from Saudi Arabia may be the catalyst that catapults CL out of this triangle and to new highs for 2019 and beyond.
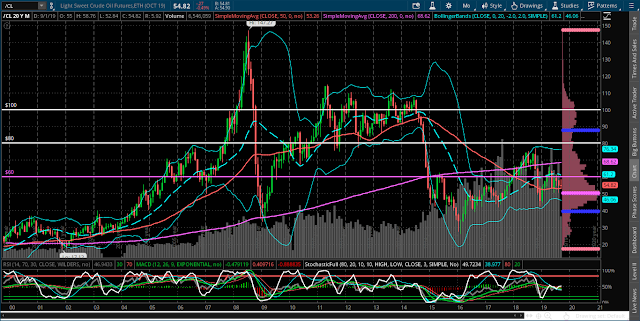
From the Volume Profile shown on the right-hand side of the following monthly chart of CL, major support sits at 50.00, which happens to be the Volume Profile's POC (point of control) on this timeframe.
Near-term resistance sits at 60.00. A breakout and hold above that could send price as high as 80.00, or even higher to 100.00, as others are now speculating.
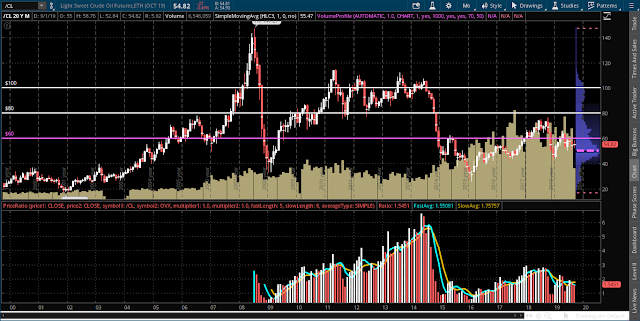
On the bottom section of the following monthly chart of CL, the ratio of Oil to its Volatility Index is shown in histogram format.
Watch for it to break and hold above 2.00, and, subsequently, 3.00 on this ratio, as well as an upside crossover of the 5 and 8 MAs, to confirm the sustainability of such a price surge.
As a side note, whether a sharp rise in Oil also drags Canada's TSX Index higher, remains to be seen. Coincidentally, I wrote about such a scenario in my post late Friday night, based on different circumstances/influences.
Here's an excerpt from that article (entitled "Canada's TSX, Election and Trade Fever").
Canada's TSX Index closed at an all-time high of 16,682.42 on Friday, after making an all-time intraday high of 16,756.11, and after launching off the median of a very long-term uptrending channel at the beginning of November, as shown on the following monthly chart.
It still has a couple of hundred points to go before it runs into its next major resistance level in the form of an external Fibonacci retracement level of 1.236% at 16,972.52.
To monitor such a possible move higher, I've shown the MOM and RSI technical indicators with their normal input values to gauge when they hit prior overbought levels. On the other hand, I've shown the ROC andATR indicators in histogram format and with an input value of one period, which may spike exceptionally high to signal exhaustion and a potential trend change when/if MOM and RSI reach overbought conditions.
Whether all those line up to co-incide with price tagging the 1.236 external Fib level is anyone's guess...but ones that can be followed on this longer-term timeframe if price continues its breakout rally...especially ahead of Canada's October election...and as Canadians, perhaps, reflect on their debt burdens.

* UPDATES...
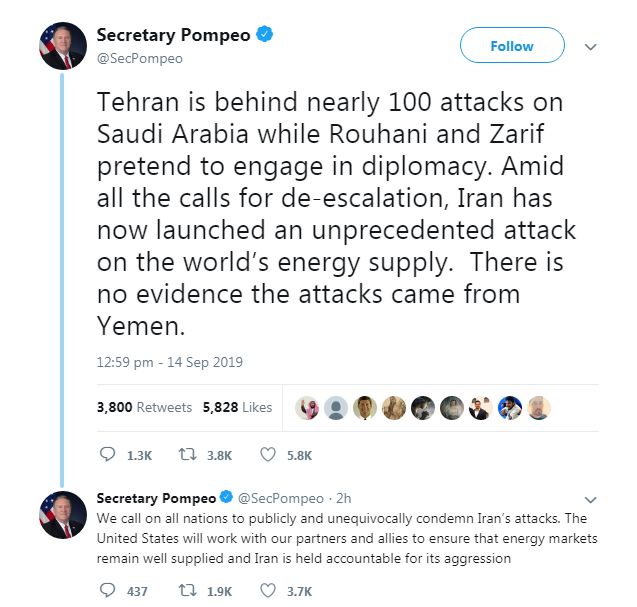
In the several hours that have passed since I posted the subject article, Secretary Pompeo has tweeted the following (he blames Iran, not Yemen, directly for the attack...reports speculate that the nature of the attack was too sophisticated to have been carried out by the Houthi rebels)...
This tweet from Reuters followed (but, exactly what "necessary measures to safeguard national assets, international energy security and ensure stability of world economy" would be taken by a Saudi-led, western-backed, Sunni Muslim military alliance, remains to be seen)...
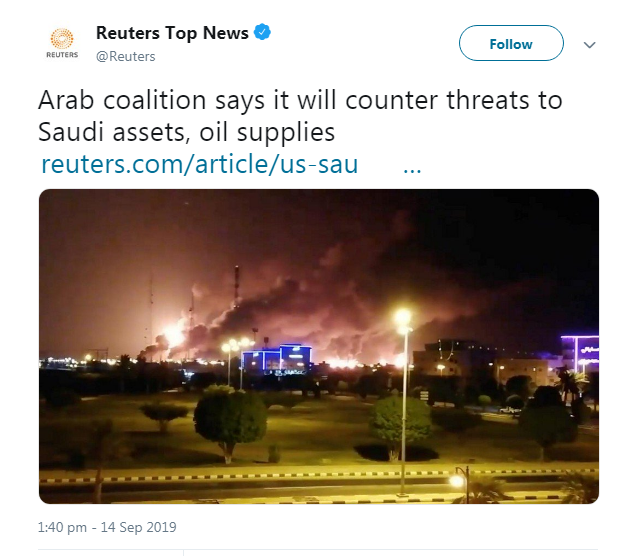
Source: Reuters.com
And, now these tweets ("expect chaos") from Zero Hedge on Sunday with a report from Goldman Sachs on oil...


Source: ZeroHedge.com
======================
In my opinion, the added risk of Middle East major military instability has now increased greatly...and could hang on for months...contributing to elevated oil volatility for some time.
And, what could be of more consequence, is the perception now that it CAN be done...again and again...especially if there are no consequences to this attack.
======================
So, what does this mean for the SPX?
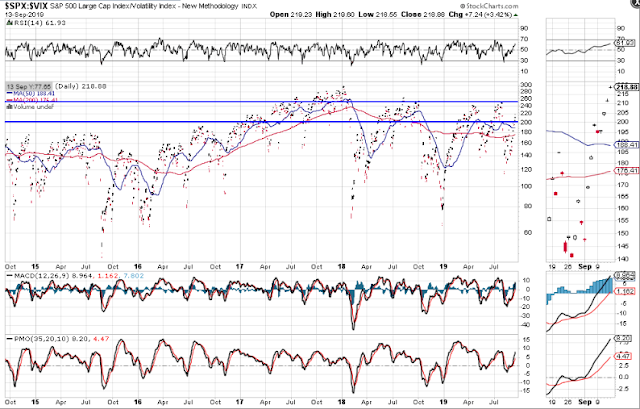
To gauge the level of volatility and direction that the SPX may experience from Monday's open onward, keep an eye on the SPX:VIX ratio...daily chart below.
Price needs to hold above 200, then watch for a climb to, potentially, retest 250, or higher, to confirm higher prices for the SPX from Friday's close...and see how overbought the RSI, MACD and PMO are by then.
Otherwise, a drop and hold below 200, would see the SPX decline...perhaps to levels mentioned in my post of August 30.
As an aside, whether any of this affects the Fed in their decision-making on whether or not to cut interest rates at their upcoming meeting this Wednesday, and whether the SPX reacts, in kind, remains to be seen.


N.B. Check out my Blog for important UPDATES I've added to this article...StrawberryBlondesMarketSummary.com
Thanks.
You're welcome...please check back periodically, as more updates are added as news emerges.