
Latin America – 2019 In Review
From a political and economic standpoint, 2019 was a challenging and interesting year for the Latin American region, but the region still finished strong. The S&P Latin America 40, Latin America’s blue-chip index, ended Q4 with a return of 9.0%, and it was up 13.9% for the year. Small-cap stocks in the region fared well, helping the broad S&P Latin America BMI return 11.1% for the quarter and nearly 22% for the year. Despite the strong performance, Latin American indices still lagged some of the global equity indices. The S&P 500® returned 9.1% for the quarter and an outstanding 31.5% for the year. The S&P Global 1200 yielded 8.9% for the quarter and 28% for the year. The S&P Emerging BMI also had a great year (up 19.9%), but still underperformed Latin America (as measured by the S&P Latin America BMI).
In 2019, all 11 GICS® sectors for Latin America posted positive returns, as measured by the S&P Latin America BMI Sector Indices. Some sectors yielded considerable returns; Health Care gained 22.0% for the quarter and was up 72.2% for the year. Information Technology and Real Estate were next, yielding 43.5% and 42.3% for the year, respectively. Materials had a strong quarter, returning 16%, which helped to bring the sector into positive territory for the year, ending with a mere 4.4%—the lowest annual return of the sectors.
Besides sectors, it is clear that Brazil’s positive performance was a big contributor to the overall performance of the region. Brazil not only had a stellar quarter with the local benchmarks, as the IBrX 100 and the S&P Brazil BMI both yielded around 11%, but the country also had a banner year, providing returns in the mid-30% range in local currency terms.
With the growing trend of factor indices in Brazil, we see that most did well for the year, and in most cases, returns were above 40% in local currency and USD. However, the risk data was also high, particularly for the USD-denominated indices. Local investors took on less risk when removing the currency exchange rate from the performance calculation.
Chile was the worst performer amid the political unrest the country underwent during the last quarter. No headline index was unscathed, and they all ended the quarter and the year in the red. Hardest hit were mid-cap stocks, as measured by the S&P/CLX IGPA MidCap, which lost 14% for the quarter. The banking sector was hit particularly hard, with losses of 21%, as measured by the S&P/CLX Banks Index. The S&P/CLX Utilities & Telecom Index surprisingly gained 7.5% for the quarter and nearly 16% for the year.
Mexico, the second-largest market in the region after Brazil, had a good year. Mexico’s flagship index, the S&P/BMV IPC, returned 1.2% for the quarter and 4.6% for the year. The S&P/BMV FIBRAS Index, which seeks to track the performance of the local real estate income trust stocks, and the recently launched S&P/BMV Ingenius Index, which is designed to measure 12 of the most innovative companies in the world trading in Mexico, each had returned over 40% for the year. For the quarter, the S&P/BMV China SX20 Index had the best return, up 10.8%.
Among factor indices in local currency, the S&P/BMV IPC CompMx Short-Term Momentum Index and the S&P/BMV IPC CompMx Quality Index (each with 15 stocks representing the top companies within each factor) had returns of 16.5% and 18.4% for the year, both with relatively low risk.
Argentina was the most volatile market in the region in 2019, mostly triggered by the extreme depreciation of the Argentinian peso, the continuous increases in inflation rates, and the uncertainty following the recent change in government. For the year, the S&P MERVAL Index returned 37.6% in ARS. The Argentinian market generated the highest volatility data of the region, as the three- and five-year risk rates based on standard deviation for the S&P/BYMA Argentina General Index were 42% and 38%, respectively.
Finally, markets in Colombia and Peru had good years. The flagship indices, the S&P Colombia Select Index and the S&P/BVL Peru General Index returned 30.0% and 6.1% in local currency terms, respectively.
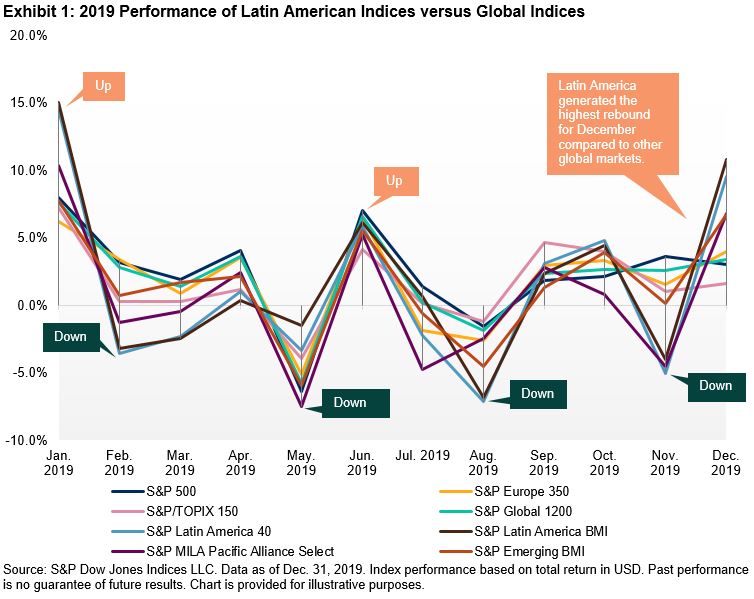
As a recap for the year, Exhibit 1 shows the performance of the three Latin American regional indices compared with other global equity markets and regions, based on monthly returns. Overall, we found that the markets were steady; the ups and downs were not as drastic as the previous year. The last month was particularly intense for Latin America, as the region experienced a strong recovery.
(Click on image to enlarge)
With the new year, new challenges and new opportunities arise. It will be interesting to see the development of these markets in the coming months.
Copyright © 2020 S&P Dow Jones Indices LLC, a division of S&P Global. All rights reserved. This material is reproduced with the prior written consent of S&P DJI. For more information ...
more

