
Lackluster U.K. Employment Report To Drag On GBP/USD Rate
Updates to the U.K. Employment report may produce headwinds for the British Pound as the figures are anticipated to show a slowdown in both job and wage growth.
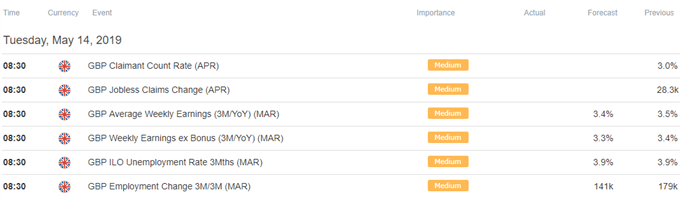
The U.K. economy is anticipated to add 141K jobs in the three-months to March following the 179K expansion during the previous period, while Average Weekly Earnings are expected to slow to 3.4% from 3.5% per annum in February.
Signs of a less robust labor market may spark a bearish reaction in GBP/USD as it encourages the Bank of England (BoE) to retain a wait-and-see approach for monetary policy, and the central bank may merely attempt to buy more time at the next meeting on June 20 as the Monetary Policy Committee (MPC) insists that ‘U.K. data could be unusually volatile in the near term, due to shifting expectations about Brexit in financial markets and among households and businesses.’
In turn, a slowdown in both job and wage growth may drag on the British Pound, but a batch of above-forecast data prints may trigger a rebound in GBP/USD as it put pressure on Governor Mark Carney & Co. to further normalize monetary policy in 2019.
IMPACT THAT THE U.K. EMPLOYMENT REPORT HAD ON GBP/USD DURING THE LAST PRINT
|
Period |
Data Released |
Estimate |
Actual |
Pips Change (1 Hour post event ) |
Pips Change (End of Day post event) |
|
MAR 2019 |
04/16/2019 08:30:00 GMT |
181K |
179K |
-9 |
-43 |
March 2019 U.K. Employment Change
GBP/USD 5-Minute Chart
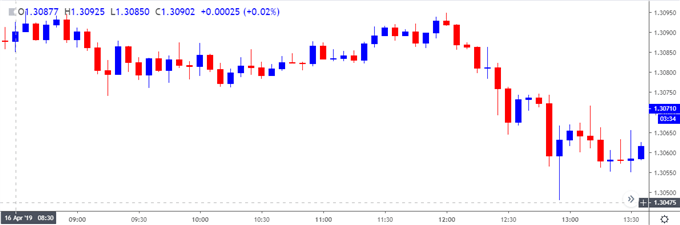
U.K. Employment increased 179K during the three-months through February after expanding 222K the month prior, while the Unemployment Rate held steady at 3.9% per annum for the second month. A deeper look at the report showed Average Weekly Earnings also holding steady at 3.5% during the same period following an upward revision for January, while Jobless Claims climbed another 28.3K in March after increasing a revised 26.7K the month prior.
The mixed figures generated a limited reaction in GBP/USD, but the British Pound struggled to hold its ground during the North American trade, with the exchange rate slipping 1.3050 region to close the day at 1.3045.
GBP/USD RATE DAILY CHART
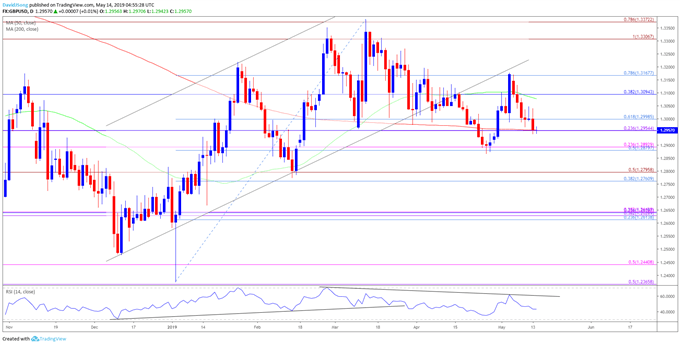
- The broader outlook for GBP/USD is no longer constructive as both price and the Relative Strength Index (RSI) snap the upward trend from late last year after failing to close above the Fibonacci overlap around 1.3310 (100% expansion) to 1.3370 (78.6% expansion).
- Moreover, former channel-support appears to be offering resistance as GBP/USD stages a failed attempt to test the April-high (1.3196), with a break/close below the 1.2950 (23.6% retracement) to 1.3000 (61.8% retracement) region opening up the Fibonacci overlap around 1.2880 (50% retracement) to 1.2890 (23.6% expansion), which largely lines up with the April-low (1.2866).
- However, lack of momentum to close below the 1.2950 (23.6% retracement) to 1.3000 (61.8% retracement) region may open up the monthly range, with a move back above 1.3090 (38.2% retracement) opening up the 1.3170 (78.6% retracement) area, which lines up with the May-high (1.3177).


