
Kiwi Price Outlook: New Zealand Dollar Counter-Offensive, First Test
The New Zealand Dollar is the worst performer year-to-date against the US Dollar with NZD/USD down more than 2.8%. A test of the May lows held last week with the recovery now eyeing near-term resistance. These are the updated targets and invalidation levels that matter on the NZD/USD charts heading into tomorrow’s FOMC interest rate decision. Review this week’s Strategy Webinar for an in-depth breakdown of this setup and more.
KIWI PRICE CHART - NZD/USD DAILY
(Click on image to enlarge)
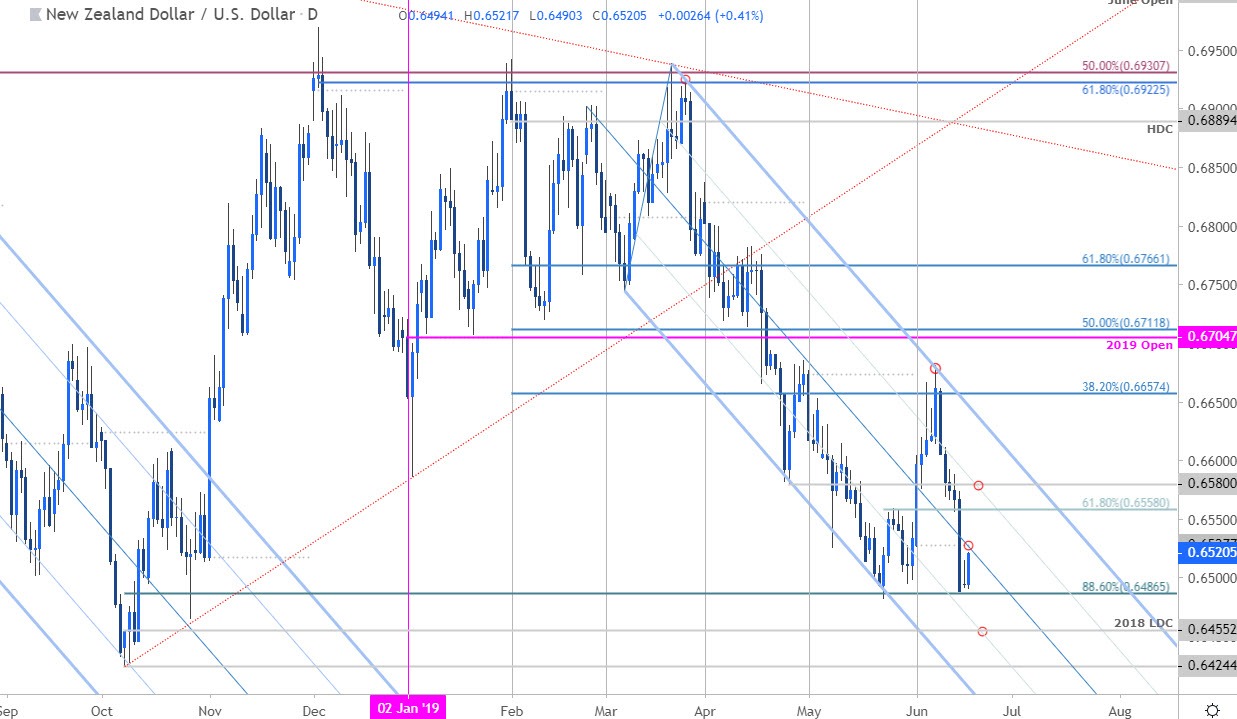
Technical Outlook: In my latest New Zealand Dollar Weekly Price Outlook we noted that Kiwi had, “broken the monthly opening-range lows with the decline taking price into weekly support – risk remains for possible downside exhaustion.” Price turned just pips from the 88.6% retracement of the 2018 advance at 6487 with the subsequent rebound now targeting monthly open resistance at 6528.
A breach/close above the median-line is needed to suggest a larger recovery is underway targeting the 61.8% retracement at 6558 and the April lows at 6580. Broader bearish invalidation stands with the upper parallel. A break lower from here would mark resumption of the March downtrend targeting the 2018 low-day close at 6455 & the 2018 low at 6424.
KIWI PRICE CHART - NZD/USD 120MIN
(Click on image to enlarge)
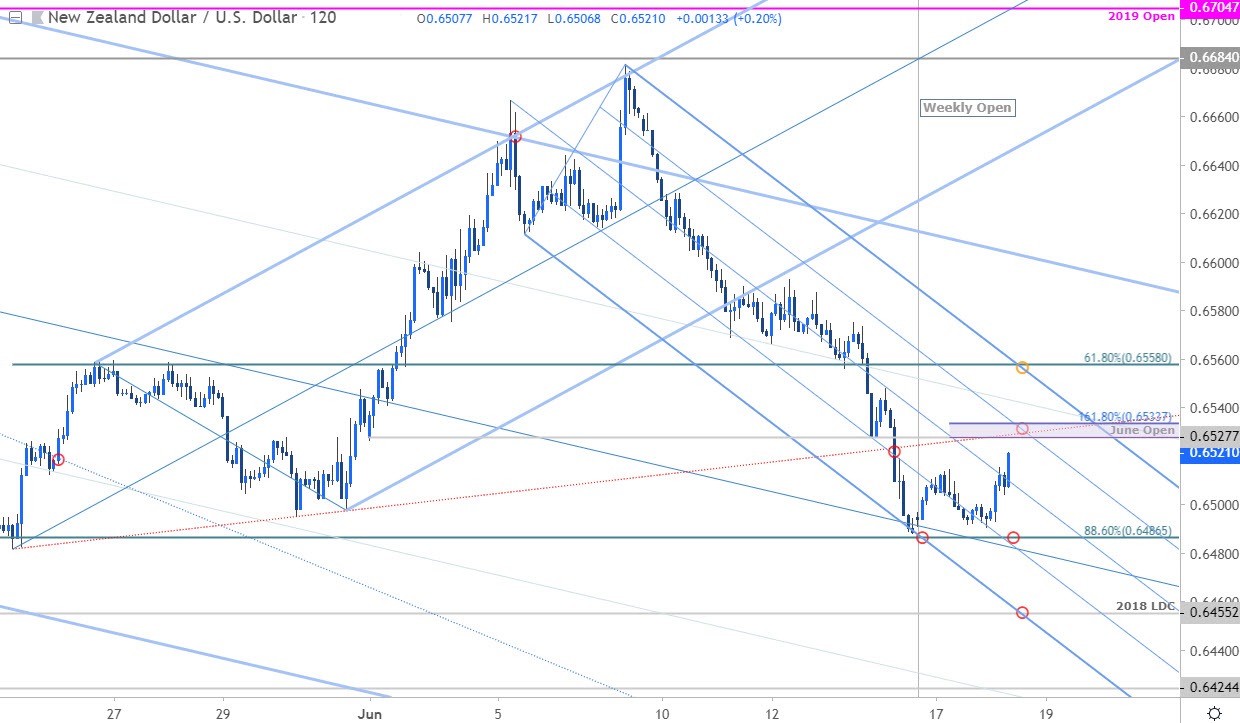
Notes: A closer look at Kiwi price action shows NZD/USD trading within the confines of a descending pitchfork formation extending off the June highs with the 75% line further highlighting near-term resistance at 6528/34 – look for a reaction there. A topside breach keeps the focus on the upper parallel / 6558 – area of interest for near-term price exhaustion. Failure to break this zone would shift the focus back towards the
Bottom line: The Kiwi recovery is now approaching initial resistance targets at 6528/33 and ultimately a topside breach of this formation is needed suggest a more significant low is in place. From a trading standpoint, look to reduce long-exposure / raise protective stops on a move into this resistance zone - risk for near-term exhaustion but IF price is heading higher, losses should be limited to the weekly open. A break of the weekly opening-range lows would keep the focus on 6455.
NZD/USD TRADER SENTIMENT
(Click on image to enlarge)
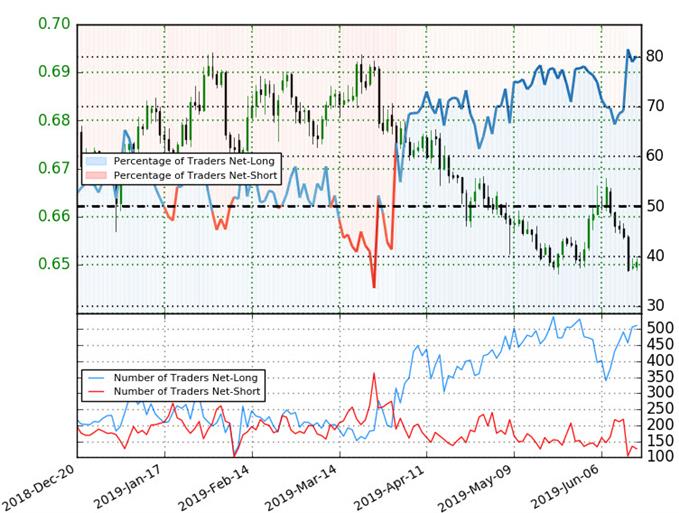
- A summary of IG Client Sentiment shows traders are net-long NZD/USD - the ratio stands at +4.02 (80.1% of traders are long) – bearish reading
- Traders have remained net-long since April 2nd; price has moved 5.3% lower since then
- Long positions are 7.4% higher than yesterday and 32.0% higher from last week
- Short positions are 1.6% higher than yesterday and 32.1% lower from last week
- We typically take a contrarian view to crowd sentiment, and the fact traders are net-long suggests Kiwi prices may continue to fall. Traders are further net-long than yesterday and last week, and the combination of current sentiment and recent changes gives us a stronger NZD/USD-bearish contrarian trading bias from a sentiment standpoint.


