
Japanese Yen Forecast: USD/JPY Rips Into Resistance- Bulls Eye 110

JAPANESE YEN TECHNICAL PRICE OUTLOOK: USD/JPY WEEKLY TRADE LEVELS
- Japanese Yen technical trade levels update – Weekly Chart
- USD/JPY breakout extends into confluent uptrend resistance
- Constructive while above 107.83 – Key resistance at 109.68/92
The Japanese Yen is down more than 0.7% against the US Dollar this week with the multi-month rally in USD/JPY extending into resistance at nine-month highs. While the broader technical focus remains weighted to the topside, the immediate advance may be vulnerable while below this key threshold and we’re looking for possible inflection in the days ahead for guidance. These are the updated targets and invalidation levels that matter on the USD/JPY weekly price chart heading into tomorrow’s highly anticipated FOMC rate decision. Review my latest Weekly Strategy Webinar for an in-depth breakdown of this Yen technical setup and more.
JAPANESE YEN PRICE CHART – USD/JPY WEEKLY
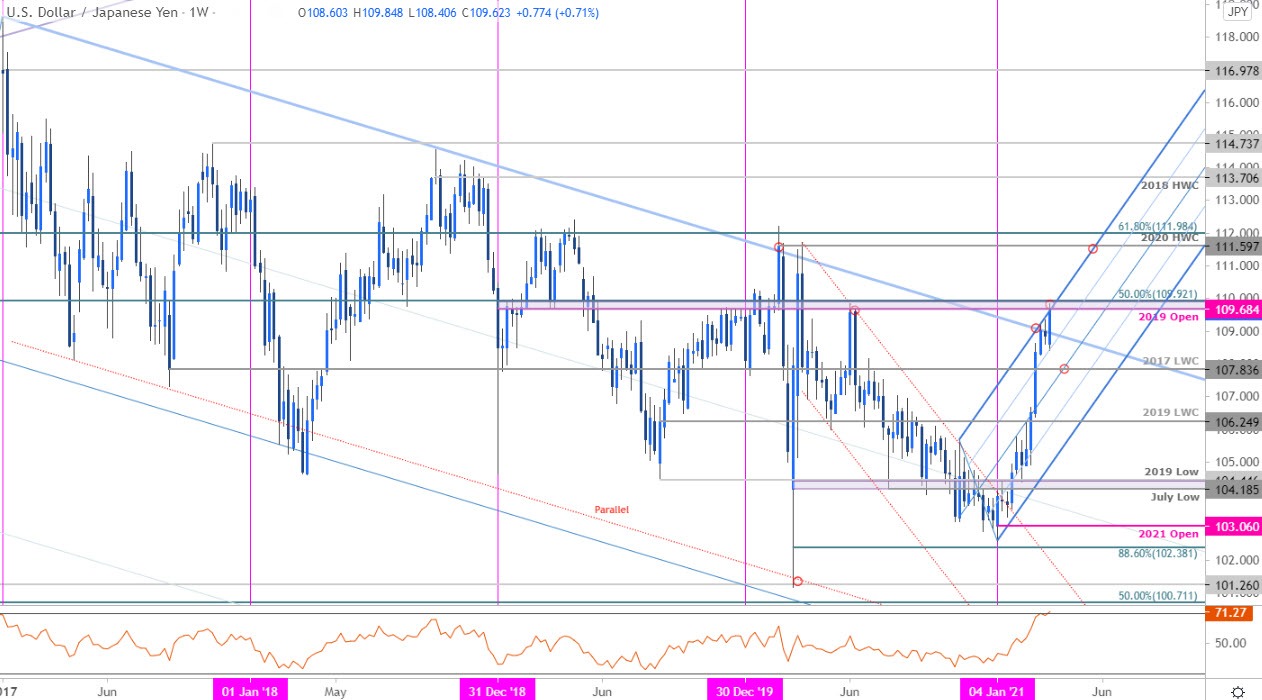
Chart Prepared by Michael Boutros, Technical Strategist; USD/JPY on Tradingview
Notes:In my last Japanese Yen Weekly Price Outlook we highlighted that the USD/JPY rally was, “testing confluence uptrend resistance – the immediate long-bias may be vulnerable while below 109.68/92… be on the lookout for topside exhaustion into this resistance zone.” Price rallied into this threshold on Friday and the focus remains on possible inflection off this zone.
An outside-week reversal into this high suggests the risk for near-term exhaustion with initial weekly support eyed back at the median-line (currently ~108.60s) and the 2017 low-week close at 107.84- a break / close below this threshold would be needed to suggest a more significant high was registered this week. A topside breach here would likely fuel another bout of accelerated gains for the Dollar with such a scenario exposing subsequent resistance objectives at the 2019 / 2020 high-week closes at 111.53/60 and the 61.8% retracement of the late-2016 decline at 111.98.
Bottom line:
The USD/JPY rally has extended into make-or-break resistance here at the 109.68/92 – the immediate advance remains vulnerable while below this threshold near-term. From a trading standpoint, a good zone to reduce long-exposure / raise protective stops – look for downside exhaustion ahead of 107.83 on pullbacks IF price is indeed heading higher with a breach / close above this week’s high needed to mark resumption of the broader yearly uptrend. Stay nimble heading into the close of the month / quarter as the risk remains for a larger washout here– ultimately a larger pullback may offer more favorable opportunities closer to trend support.
JAPANESE YEN TRADER SENTIMENT – USD/JPY PRICE CHART

- A summary of IG Client Sentiment shows traders are net-short USD/JPY - the ratio stands at -1.33 (42.92% of traders are long) – weak bullish reading
- Long positions are4.28% lower than yesterday and 21.81% higher from last week
- Short positions are 3.65% lower than yesterday and 10.79% lower from last week
- We typically take a contrarian view to crowd sentiment, and the fact traders are net-short suggests USD/JPY prices may continue to rise. Traders are more net-short than yesterday but less net-short from last week. The combination of current positioning and recent changes gives us a further mixed USD/JPY trading bias from a sentiment standpoint.
USD/JPYMIXEDData provided by IG
| CHANGE IN | LONGS | SHORTS | OI |
| DAILY | -9% | -2% | -5% |
| WEEKLY | 15% | -7% | 0% |
KEY US / JAPAN DATA RELEASES
Economic Calendar - latest economic developments and upcoming event risk.
Disclosure: See the full disclosure for DailyFX here.


