
Is Australia On A 5.55% Gold Standard?
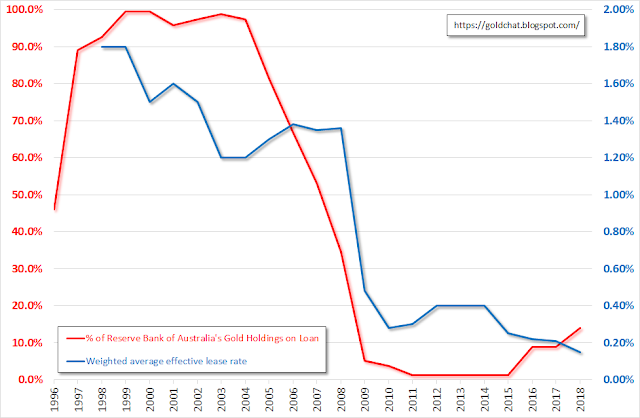
The Reserve Bank of Australia (RBA) recently came under criticism in The Mystery Of The Missing Australian Gold regarding its gold leasing activities (see my initial response to John and Martin). Drilling into the RBA's annual reports I came across some curious relationships between Australia's gold reserves and its money supply. Before I get to that, there is some additional detail I missed in respect of the RBA's gold management and John and Martin's comment that the 0.15% earned on our gold was non-commercial. To recap, the chart below shows the historical gold lease rates (blue line) the RBA has achieved.
To put that rate in perspective, Nick Laird from Gold Charts 'R' Us helps out with this derived lease rate chart, which provides more recent figures than the chart in my previous post. For those interested in historical context, the London Bullion Market Association provides public charts of derived (ie LIBOR - GOFO) gold lease rates here from 1990 to 2015 (GOFO benchmarks ceased in 2015). Note: current actual lease rates are only available on paid subscription sites with some derived data being produced by Monetary Metals for free if you sign up.
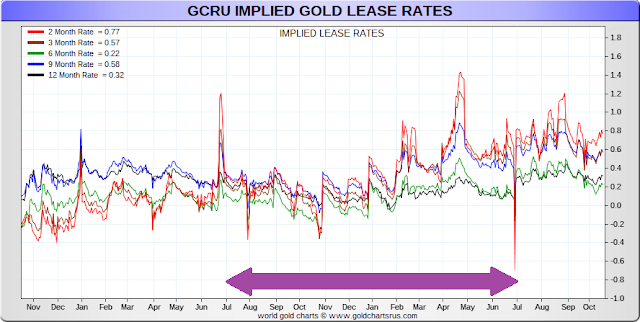
The purple arrow indicate the time period related to the RBA annual report where the 0.15% figure was reported. To confirm whether 0.15% is reasonable, we need to know for what durations the gold was leased. While the RBA ceased reporting on the credit limit breakdown of its leases (as I reported on here), they still provide a duration breakdown, see the chart below.
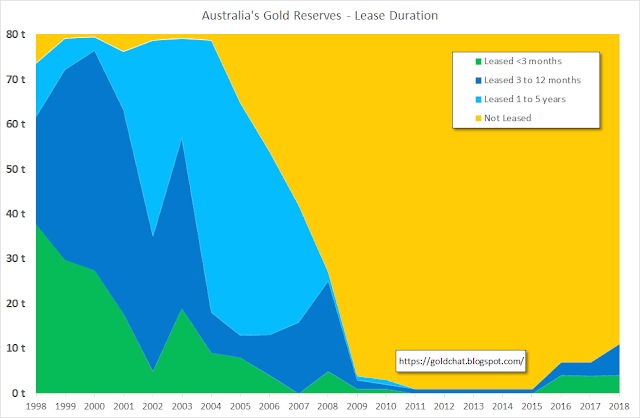
The RBA reported average balance was 4 tonnes in less than 3 months and 5.1 tonnes between 3 to 12 months. That works out about 5 months average duration, which is closest to the 6 month green line in Nick's chart. In that case, the 0.15% looks like a fair result from the RBA compared to market rates. Having said that, the 0.15%, in my opinion, is too low notwithstanding the RBA is lending on a collateralised basis or to entities with "government support". The red line on the first chart shows that the RBA was pretty much lending out all of Australia's gold reserves prior to 2005 but sharply pulled out of the market as its longer term (1-5yr duration) leases matured into a market where lease rates were sub 0.40%. It clearly didn't think the risk/return tradeoff was right at the time and that was prescient considering the GFC hit in 2008. If the RBA is willing to increase its gold leases at 0.15% it must now consider everything has been fixed and financial risks are low - a position many would think is questionable.
In the video, Martin used the treasury 10 year rate as a comparison but even if cash and gold rates were comparable, this was unlikely to be a fair comparison as the gold market tends to concentrate lending in the shorter end. The chart above from the RBA shows this and if you look at Comex gold futures open interest or LME forwards (which only go out to 5 years), you will see that the liquidity is focused on the short end (note: future and forward prices are related to leasing rates). Compared to maturity transformation in dollar banking, where banks lend for durations beyond 20 years (eg your conventional home mortgage), this concentration on the short end is very significant when trying to assess the risks fractional reserve bullion banking poses to the gold market. The lower the maturity transformation the less a bullion bank is likely to get caught in a run on unallocated gold (although this assumes that bullion banks source a lot of funding via unallocated balances, which is not something there is data on). The RBA also provides historical statistics on its balance sheet, which enable us to look back to 1969 to see how much of the bank's reserves were in the form of gold (note the changing balance of gold reserves pre 1992 may be more a factor of my estimated exchange and gold prices when trying to convert the RBA's AUD balances into ounces).
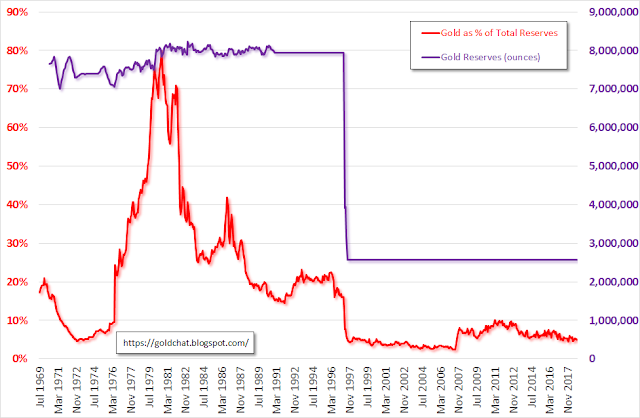
The big increase in the 1970s is obviously a function of the bull market in gold but outside of that Australia seems to have been averaging around 20% of its reserves in gold. After the big sale in 1997, it is remarkable that the percentage is relative stable. Interestingly, up until 1931, Australia's gold reserve requirement was 25% in gold coin or bullion on bank notes (link), after which there was no requirement. I wonder if the figures from 1931 to 1969 would show a de facto 25% standard being maintained. Speaking of bank notes and gold backing, calculating the value of Australia's gold reserves as a percentage of banknotes on issue produces the chart below.
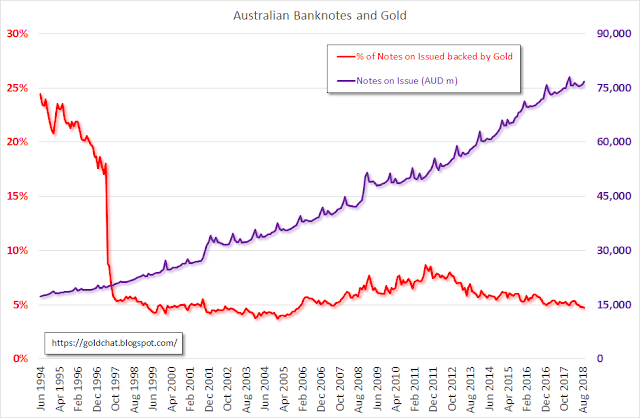
Isn't that a curious stability, averaging 5.55% within a range of 3.7% to 8.6% since the sale - is the RBA surreptitiously maintaining Australia on a 5.55% gold standard? One final observation: if we were to move to 100% gold backed banknotes it would require Australia to hold gold reserves of 1,457 tonnes. At Australia's current rate of gold mine production, it would only take five years to get there. Something to aim for, or is Australia better off to just keep shipping its gold off to China?
Disclosure: None


Wow, this is a mystery... and one I wasn't even aware of!