
How To Develop A Balanced Portfolio Amid European Volatility
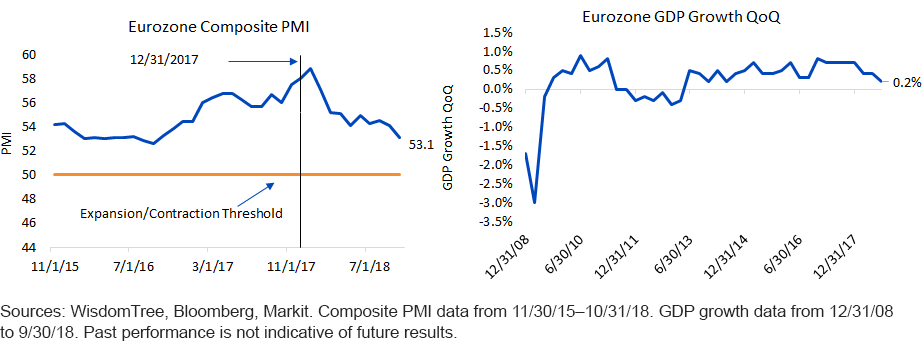
There’s no sugarcoating it: the performance of European equities in 2018 has been disappointing. The weak performance year-to-date, as measured by the -10.56% return for the MSCI Europe Index,1 has been accompanied by a marked slowdown in economic growth in the eurozone. Two major indicators used as bellwethers of economic growth, composite PMIs and real GDP growth, have both trended downward, albeit while still signaling economic expansion. Signs such as these—that this pullback is associated with weakening economic fundamentals—are cause for greater scrutiny for global asset allocators. Below, we discuss some ways investors may want to think about risk, and provide a few ways to diversify risk in Europe.
(Click on image to enlarge)
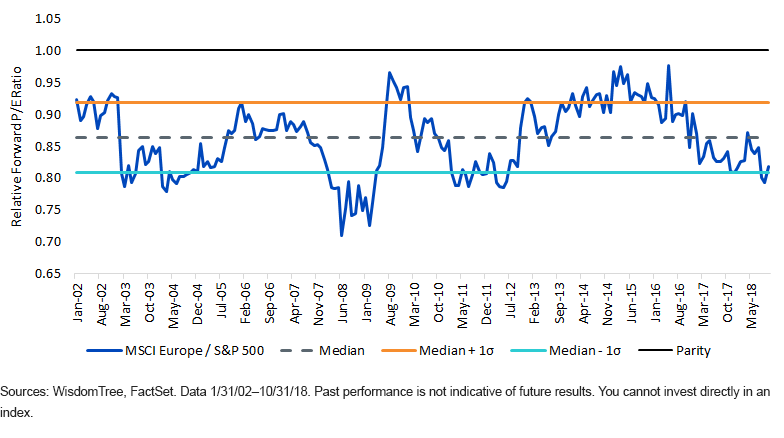
European Valuations: An Historical Review
For equity investors, particularly those with a long-term investment horizon, uncertainty tends to bring opportunity. Based on forward price-to-earnings (P/E) ratios, the MSCI Europe Index is currently priced, relative to the S&P 500 Index, at valuationsthat were last regularly seen in 2011, at the height of the European sovereign debt crisis. Today’s 16.1x forward P/E for the S&P 500 Index is an approximately 22% premium on the 13.2x forward P/E for the MSCI Europe Index.2
European equities tend to be more volatile than U.S. equities, and have thus traded at a chronic discount to their U.S. counterparts. Over time, the median ratio of the MSCI Europe Index forward P/E to the S&P 500 Index has been 0.86. Today’s ratio of 0.82 is nearly a full standard deviation below that median, signaling a potential buying opportunity. While the outlook for Europe is mixed, most notably due to Brexit, Italy’s budget and the end of quantitative easing, today’s valuations appear to appropriately compensate for those risks.
While short-term catalysts may prove illusive, most investors still maintain some exposure to Europe. In our view, an allocation to Europe blending large-cap multinationals that are directly tied to global growth with domestically-driven small-caps for a more balanced portfolio approach could add value in this type of environment.
MSCI Europe Index Forward Price-to-Earnings Relative to S&P 500 Index
(Click on image to enlarge)
A Blended Approach: Multinationals and Small-Caps
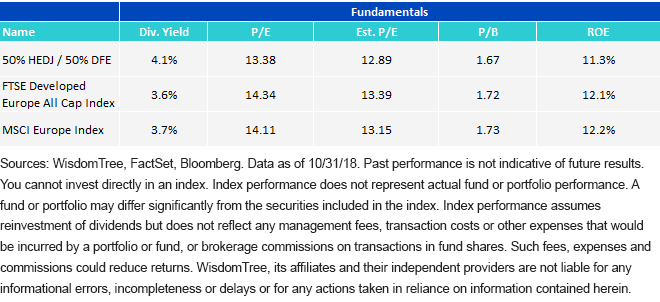
While some investors may have a dedicated European large-cap exposure in their global portfolios, far fewer most likely have dedicated exposure to European small-caps. This could be a costly mistake. In the European market, there is a significant difference between large- and small-cap companies in terms of where they derive their revenue from, geographically. Similarly, they also provide different exposure across sectors. We believe a blend of large- and small-caps can offer a unique complement, particularly when currency volatility is mitigated with a 50% currency-hedged baseline as discussed in a recent post.
The WisdomTree Europe SmallCap Dividend Fund (DFE) and the WisdomTree Europe Hedged Equity Fund (HEDJ) both track indexes that have an annual rebalance back to relative value each June. This rebalanceprocess results in these Funds taking the relative valuation discount of Europe a step further than seen in the broad market-cap weighted MSCI Europe and FTSE Developed Europe All Cap Indexes. In the table below, we show a hypothetical portfolio of 50% HEDJ and 50% DFE relative to these two broad indexes. The higher dividend yield of 4.1% would be expected from a blend of two dividend-focused funds, but the disciplined annual rebalance back to fundamentals also results in lower valuations seen across P/E and price-to-book (P/B) ratios.
Fundamentals Comparison
For standardized performance of the Funds in the chart please click their respective tickers: DFE, HEDJ.
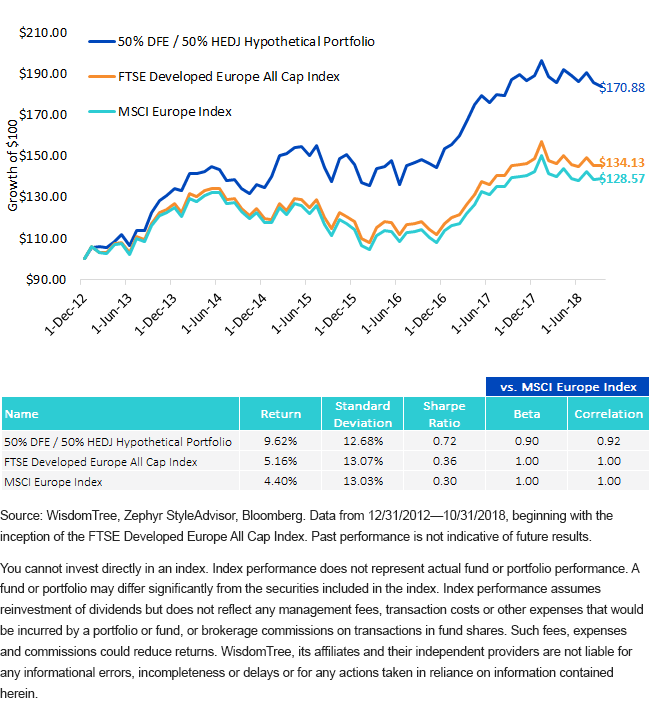
Most investors would expect a portfolio with a 50% allocation to small-caps to be accompanied by a significant increase in volatility: however, that has not been the case for our hypothetical portfolio. Over nearly six years, this hypothetical portfolio could have significantly outperformed the two widely followed European benchmark indexes on both an absolute and risk-adjusted basis. The Sharpe ratio of 0.72 for this hypothetical portfolio more than doubled the Sharpe ratio of 0.30 for the MSCI Europe Index.
In addition to the lower volatility benefits of both dividend weighting and currency hedging for the respective funds, HEDJ and DFE had only a modest correlation to each other (0.63),3 which helped to further reduce the volatility of the hypothetical blend. The driver of this lower correlation was often closely linked to the euro. During a weak euro environment, HEDJ tended to perform better by neutralizing the currency weakness for dollar-based investors. During a strong euro environment, DFE tended to perform better because of the tailwind of the currency return.
Cumulative Growth of $100
Conclusion
The low correlation between these two Funds and our long-held conviction in international small-caps as an under-owned asset class are at the core of why we favor combining these European exposures. In tilting toward the size premium as well as domestically-oriented growth prospects, we believe investors should use every tool in their arsenal for volatility reduction. While the outlook for Europe remains uncertain, taking a more diversified approach to risk could add value in the long run.
1Sources: WisdomTree, Bloomberg. 12/31/17–11/15/18.
2Sources: WisdomTree, FactSet. 10/31/18.
3Sources: WisdomTree, Zephyr StyleAdvisor. 12/31/12–10/31/18.
Disclaimer: Investors should carefully consider the investment objectives, risks, charges and expenses of the Funds before investing. U.S. investors only: To obtain a prospectus containing this ...
more

