
Hedge Fund Net Leverage At All Time Highs As No Dips Are Sold
Two weeks ago, JPMorgan's prime desk wrote about 2 main themes among the hedge fund community: elevated leverage levels and low exposure to cyclicals/value that tend to do better when rates are rising. However, over the past week, both of these things have come into sharper focus as US equities suffered one of their larger pullbacks in a while and rates globally jumped higher towards the end of this week.

So what has the largest bank's prime brokerage desk seen in the past week?
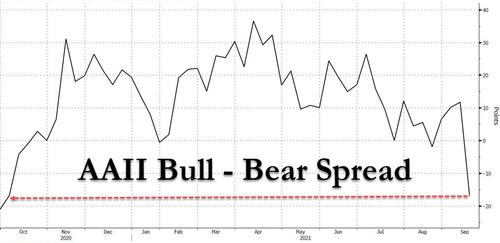
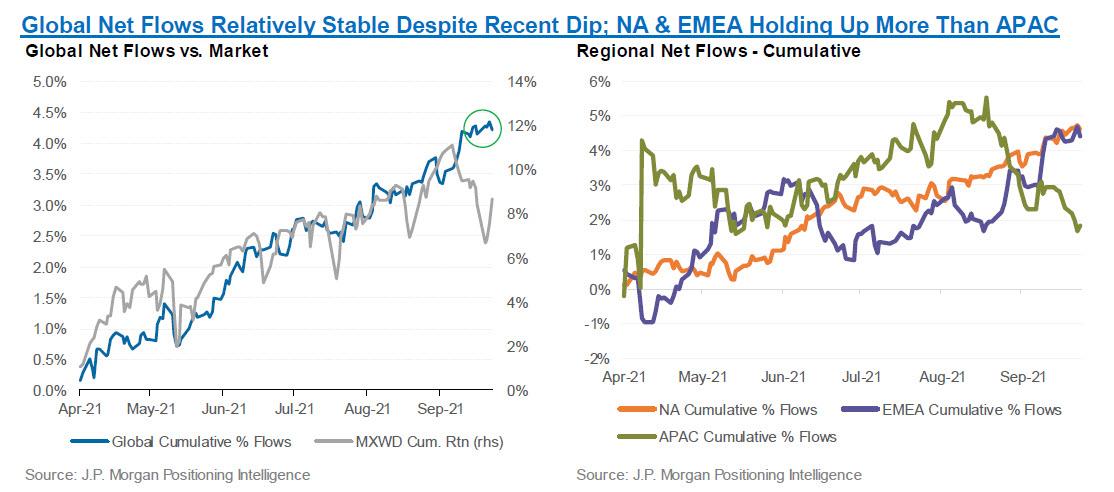
According to the latest weekly Positioning Intelligence report published by the bank, at a high level, it seems that HFs are not that concerned about the broader market (nor is anyone else for that matter) with the bank finding that over the past few months, there’s been limited willingness to sell dips. In line with this, the bank saw neutral flows globally over the past week with small buying on Monday, alongside retail BTFDers, even as professional sentiment tracked by AAII turned the most bearish since last October...
... followed by small selling on Thursday. But more generally, net flows globally have remained neutral to skewed towards buying in the past 2 weeks with Asia the only region to see some selling.
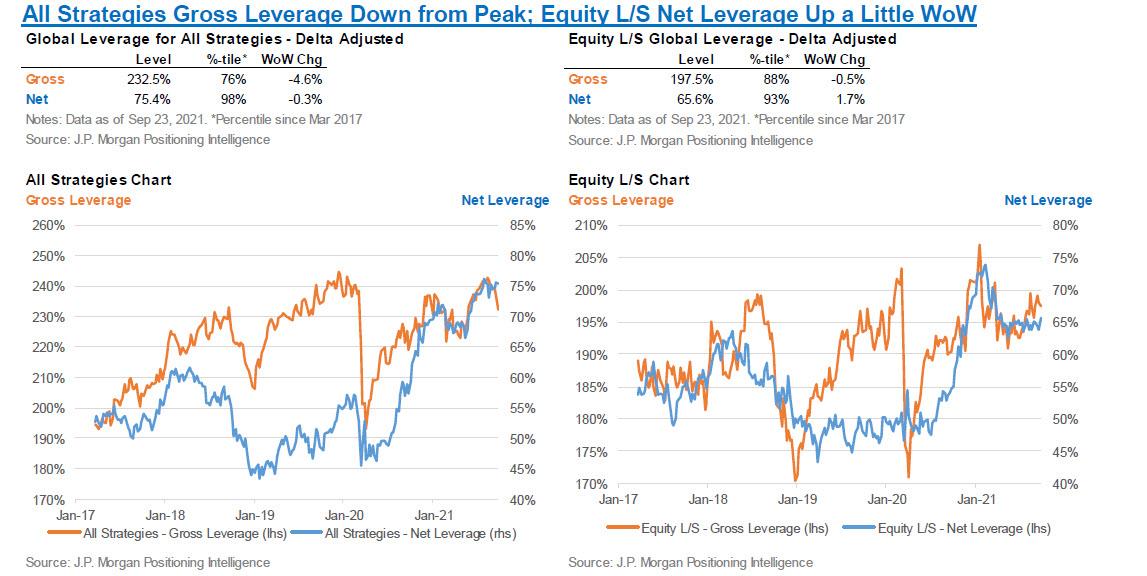
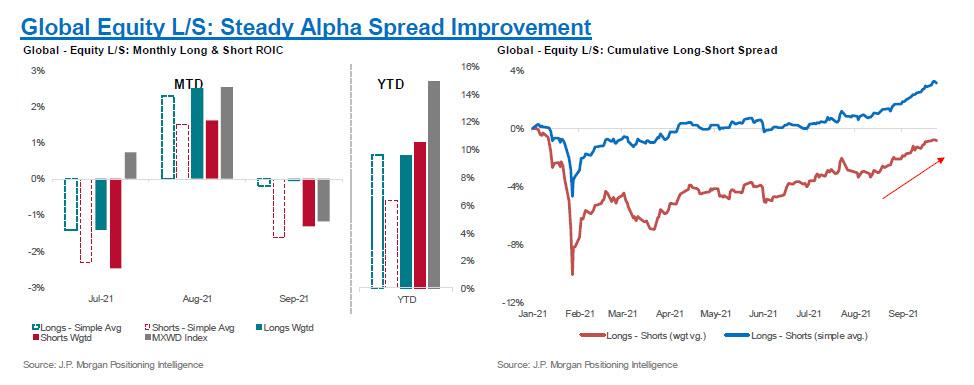
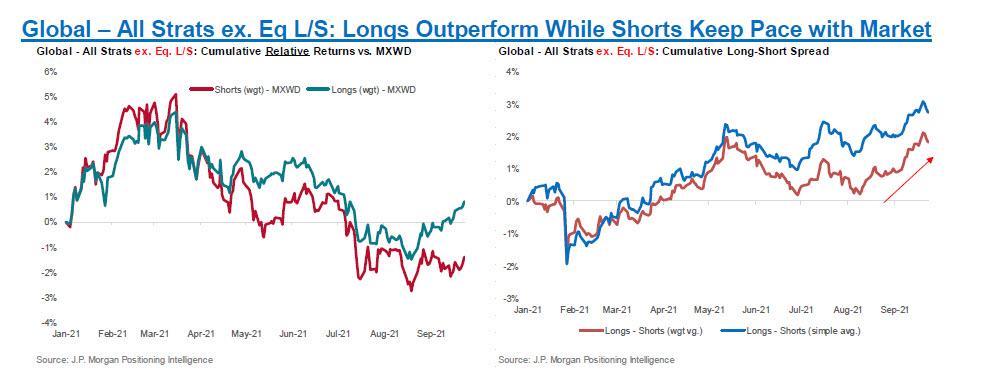
Furthermore, as has been the case for much of 2011, net leverage remains near highs with little change in the past few weeks—net at 98th percentile (of all time) across All Strategies. While gross leverage has come down a little to the 76th percentile, that appears to be more derivatives related and there could be an element of Quadruple Witching that might be impacting this as the largest gross leverage reductions were among Multi-Strat funds. According to JPM, one reason why leverage and flows among HFs might be more neutral this month is that performance has held in relatively well MTD: long-short spreads have been improving over the past few months. Looking at this month, longs are holding up well, while shorts are down in line with the market. This leaves HFs up slightly MTD, according to JPM estimates.
Back to the topic of leverage, FINRA just came out with its latest statistics on Margin Debt which showed them at a new ATH. Given it is up almost 60% since the start of 2020, it begs the question Bank of America asked one month ago: should we be concerned? Not surprisingly, JPM dismisses this indicator and thinks "this alone is not something that is concerning when one breaks down the changes and behavior to account for how the market has been performing." Furthermore the JPM prime desk notes that "this appears to be very different from the peaks in 2000 and 2007 when Margin Debt rose about 50% faster than the S&P 500 over a 12-month period." Instead, to JPM the recent moves seem more reminiscent to what happened in the early 90s.
At a more micro level, cyclicals / value / inflation / travel related stocks have all been doing better recently as COVID are falling once more, some travel restrictions are getting lifted, and rates are rising globally.

In line with this, JPM continued to see buying of NA Financials, something that has been noted over the past few weeks, but this week JPM saw Banks getting bought (vs. more Insurance and Div. Fins in prior weeks). COVID recovery stocks have also been bought but there’s room for more to go as positioning and valuations remain low in many cases (especially among the US COVID – Domestic Recovery basket, JPAMCRDB). EMEA Travel & Leisure stocks saw strong buying in the past week as the US prepares to drop its ban for transatlantic travel, and net positioning is getting a bit elevated vs. history; however, EMEA Airlines still has low positioning. Finally, not everything cyclical is getting bought—HFs have continued to sell Energy into strength - despite the recent surge in oil and all other commodities - and have also sold Materials.
Below we share some more details on each of these core themes
Main theme #1: Global Flows and Leverage: HFs Don’t Seem Too Concerned
While markets have been volatile over the past week, due to the myriad concerns, HF flows remained quite calm. The reason is that hedge funds have been reluctant to sell dips and that appeared to be the case again last Fri/this Mon as global flows were quite neutral. However, at the same time, HFs are also not chase the rally as the JPM Prime net flows were fairly neutral on Wed and skewed towards selling on Thurs when markets rallied back.
A notable observation is that there appears to be some strategy differences in the past 2 weeks as Equity L/S and Quant funds have been buyers while Multi-Strats have been net sellers across JPM prime. The selling among Multi-Strats comes as gross and net leverage have started to pull back from peak levels.
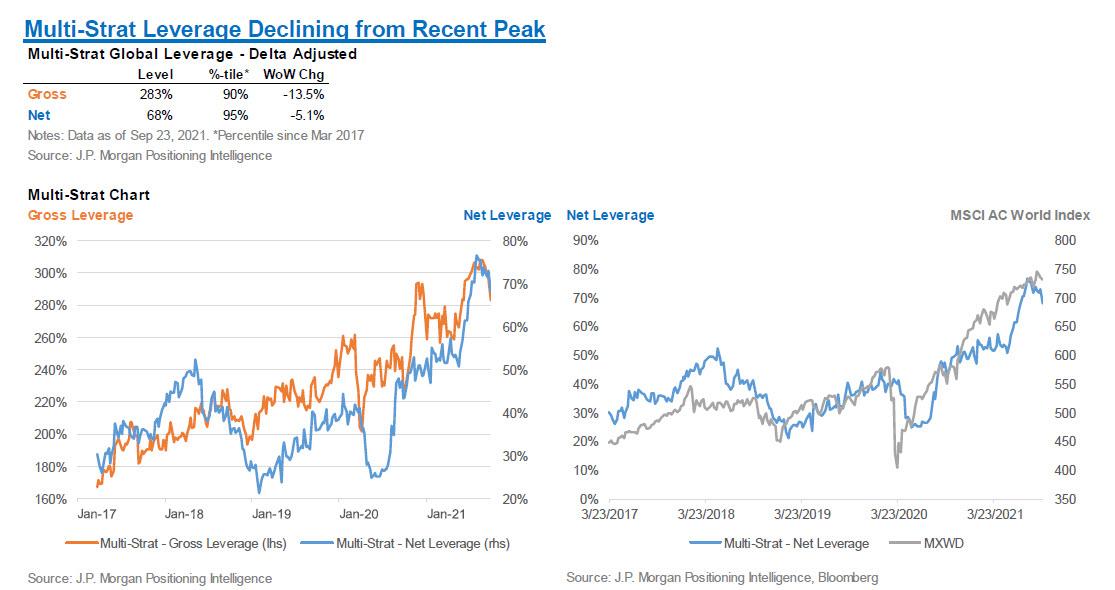
The gross reductions among some Multi-Strat funds have been the main driver of the broader “All Strategies” gross leverage figure lower WoW. However, net leverage was basically unchanged. Furthermore, it appears derivative positions might be driving some of the changes as notional LMV and SMV increased WoW while delta adjusted LMV and SMV fell.
Among Equity L/S funds, who have been moderate net buyers of equities most days MTD, net leverage actually rose slightly WoW and it’s now at the 93rd %-tile since Mar 2017.
#2: US Margin Debt: New ATHs at End of Aug…Should We Be Concerned?
FINRA just released the latest monthly stats on “Margin Debt” which showed a fairly large increase, following a decrease in July. As Margin Debt is at new All-Time-Highs and is now up almost 60% since the start of 2020, it’s worth asking -as BofA did one month ago - if this is something we should be concerned about (BAC).
In order to answer this, we’ve looked at the relationship between Margin Debt and the markets over time, augmenting the data FINRA has on it’s website with NYSE Margin Debt data that goes back to 1959. What this shows is that while there is a very big increase recently, it is 1) in line with the markets and 2) seems to be following the general pattern of the past 60+ years.
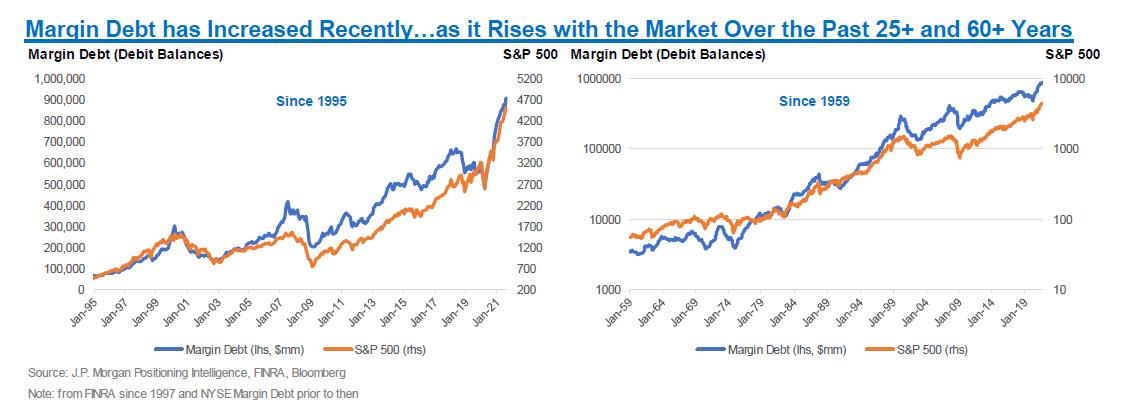
Similar to discussions of rate-driven VaR shocks, JPM argues that it’s not so much the level of Margin Debt that one should be focused on, but rather the rate of change. On this point, the bank measured the 12M change in Margin Debt and the S&P 500 over the past ~60 years and what this shows is that there is typically a fairly strong correlation over time. In particular, this correlation has been very strong since the GFC, but there were a couple notable divergences in 2000 and 2007 when Margin Debt rose much faster than the market.
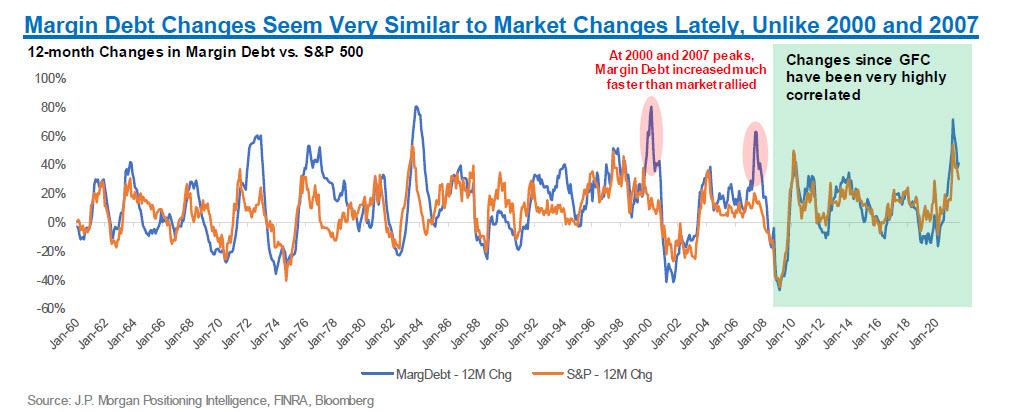
In its attempt to mitigate concerns about record margin debt, JPM then notes that increases in Margin Debt (i.e. investors taking on more leverage) that exceed the market returns by a wide margin could indicate greater potential for future stress because it might suggest that investors are adding leverage at market highs, but not actually making much money while doing so. Thus, when markets start to pull back, the recent investments start to lose money more quickly than if they had been added when the markets weren’t at highs.
Addressing this point, JPM notes that when looking at what’s happened in the past 2 years, we have seen Margin Debt increase faster than the markets on a 12M rolling basis with the difference reaching +28% at its recent high. However, the recent high in the 12M difference metric was reached in January of this year (perhaps due to the fact that HFs had performed very well in 2020 and had been adding risk throughout 2H20 in particular). Thus, this difference has been falling for much of the past 7 months. Furthermore, the recent rise follows a period when Margin Debt had generally lagged the market increases; since the start of 2018, margin debt is only up ~40% vs. the S&P up ~70% in price terms.

When it looks back even further, JPM notes that there were periods in the 70s-80s when large increases in Margin debt were followed by market weakness, suggesting this isn’t only a 2000 and 2007 phenomenon (left chart below). Furthermore, one could reasonably ask why the relatively large increase in the early 90s didn’t result in a market pullback. While there are likely other contributing factors as well, one thing to note about Margin Debt was that it had gone through a period of relatively slower growth in the late 80s, so the rise in the early 90s was somewhat of a “catch-up” period for it. Similarly, JPM argues that the rise into Jan of this year could also be considered a bit of a “catch-up” period, which appears to be different from 2000 and 2007 when Margin Debt was reaching new highs, even when measuring it relative to the S&P changes (JPM, SPX).
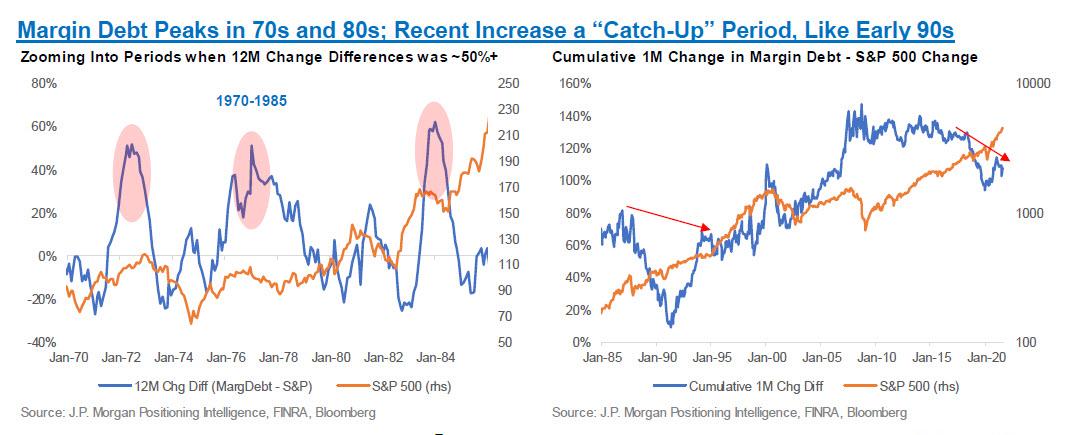
In light of the above it's hardly a surprise that JPM thinks that while there are many potential reasons one could cite for market caution, "the level and changes in Margin Debt do not appear to be setting us up for extreme market drawdowns like we saw in 2000 and 2007."
#3: Reopening/Recovery Trades Back in Focus?
With COVID cases appeared to be on the decline globally, and travel restrictions getting lifted in some places, reopening/recovery themes have been more topical as they’ve started to perform better. On the HF side, JPM Prime has seen net buying over the past 2-3 weeks in both the Domestic Recovery basket (JPAMCRDB) and the International Recovery Basket (JPAMCRIB). Positioning in both groups remains low on a YTD basis and very low on a multi-year basis for the Domestic basket. In addition, JPM’s U.S. Equity Research Strategist, Dubravko, recently wrote about this in a recent note where he showed that the COVID Recovery – Domestic basket had seen relative valuations fall back to multi-year lows while COVID Beneficiaries were back near highs.

In a similar vein, Travel & Leisure stocks have seen strong performance this week in both N. America and EMEA, along with HF buying as the US said it would remove its ban on EU travel for vaccinated passengers starting in November. The recovery in performance, relative to the market, still has more to go before getting back to where we were earlier this year. In terms of where the recent buying and outperformance leaves HF positioning, net exposures are nearing average levels among US Travel & Leisure stocks, but are a bit closer to highs in EMEA.
Where there appears to be more potential upside for positioning in EMEA is among the Airlines stocks where net exposures is still about 1z below average and JPM has yet to see shorts covered in the group, after persistent additions for the past 6 months.
Among US stocks, the rise in rates was accompanied by further buying of Inflation Winners and Rising Bond Yield Winners. Despite the recent buying, net exposure to the Inflation winners remains quite low with net exposures about 1 std dev below average and for the Rising Bond Yield Winners, the net exposure is still slightly below average.
Similarly, a couple weeks ago JPM wrote about how positioning and flows in Value vs. Growth had done a “180” in the past few months as Value had underperformed. Perhaps not surprisingly, US Value seems to be getting a revival recently as the Value factor has been bought in the past 2 weeks. This is coming from both Value Longs getting bought and Value Shorts being sold/shorted. In line with this, Growth stocks have seen some selling.
#4: Performance – HFs Holding Well in Sep
With a risk-on backdrop of cyclicals outperforming defensives, small caps rallying, and rising rates this week (Rising Bond Yield Winners up +5% WTD), Hedge Funds find themselves in the rare position of outperforming broader equity market indices MTD. And with WSB's short squeeze hunts fading, shorts are not detracting from performance as they are generally down in-line with the market; whereas, longs have fared better and protected to the downside.
Among Global Equity L/S funds, net returns continue to track positively with gains of +60-70bps MTD, outperforming MSCI ACWI (which is down -1.2%). The long-short spread has continued to improve since mid-August, driven more recently by shorts selling off faster in September than the market (down -1.3% on wgtd avg basis) and longs holding up relatively well (only down -15bps MTD).
Non-Equity L/S funds are also up MTD and outperforming global equity indices, up between +30-85bps. In terms of alpha, longs have outperformed shorts throughout most of September (some reversion over the past 2 days).
At a regional level, N. America L/S funds are flat to slightly up MTD, up around +0-30bps and are thus outpacing the SPX. The long-short spread has continued to improve steadily since mid-August but slowed yesterday as shorts outperformed. In EMEA, net returns among L/S funds are positive MTD, gaining around +0.5-1.3% and outperforming the headline European index.
Disclosure: Copyright ©2009-2021 ZeroHedge.com/ABC Media, LTD; All Rights Reserved. Zero Hedge is intended for Mature Audiences. Familiarize yourself with our legal and use policies ...
more

