
GBP/USD Price Analysis: Cable Indecisive Ahead Of Earnings Season
GBP/USD BULL STRENGTH
GBP/USD bulls have taken control of the pair as a result of a reduced demand for the US Dollar. This strength against the greenback has been observed across all G10 currencies of recent. The daily chart below shows this trend with higher highs and higher lows as indicated (yellow). This medium-term outlook suggests a bullish inclination with price concurrently respecting the support turned resistance trend line mentioned above. Although we have seen price dip below this trendline, the near term uptrend remains.
This bullish momentum is further reinforced by the RSI remaining above the 50 level but still out of overbought territory. Key Fibonacci levels are taken from the November 2007 high to the March 2020 low.
GBP/USD STRATEGY MOVING FORWARD
GBP/USD Daily chart:
(Click on image to enlarge)
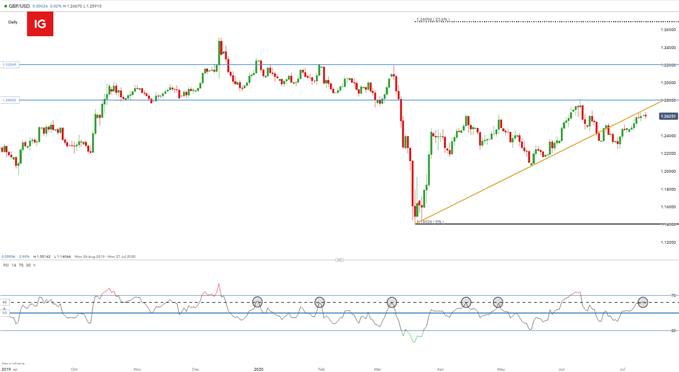
Chart prepared by Warren Venketas, IG
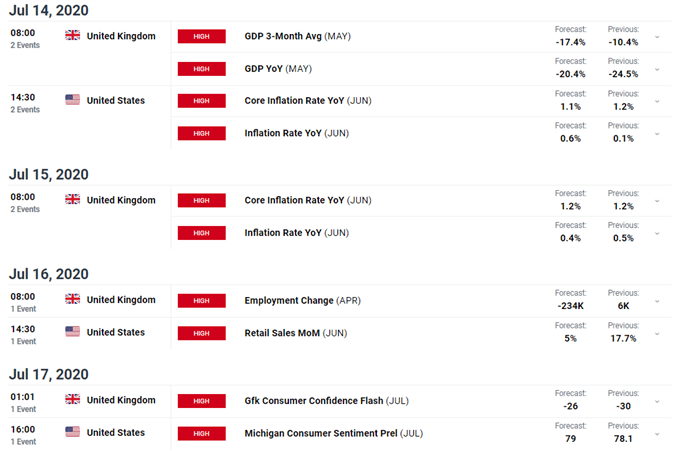
Bullish traders may look for more upside with initial resistance coming from the diagonal trend line (yellow), accompanied by stronger than expected UK economic data which is scheduled throughout this week (see DailyFX economic calendar below).
US economic data is also featured prominently this week with Inflation, Retail Sales and Consumer Sentiment data to be relayed. These economic announcements may influence the GBP/USD pair significantly so be sure to keep these in mind. This said, US earnings season kicks off this week which can increase market volatility depending on price deviation from analyst forecasts and market sentiment.
DAILFX ECONOMIC CALENDAR
(Click on image to enlarge)
The bearish perspective can be seen on both daily and 4-Hour charts. The daily RSI (chart above) is currently sitting at 62 - daily level of resistance (black) as highlighted on several occasions previously (black circles). In addition, the 4-Hour RSI (chart below) can be seen declining toward the 50 mark (black), whilst price action over the same period can be seen ascending (yellow). This is known as divergence and more specifically ‘bearish divergence’ and is suggestive of a trend reversal – in this case, from bullish to bearish.
Price action confirms this lack of impetus by bulls to push through the recent topside swing (1.26636) which seems to be a key level of resistance.This may see bears resume control and eye the initial horizontal support at 1.25 (black).
GBP/USD 4-Hour chart:
(Click on image to enlarge)
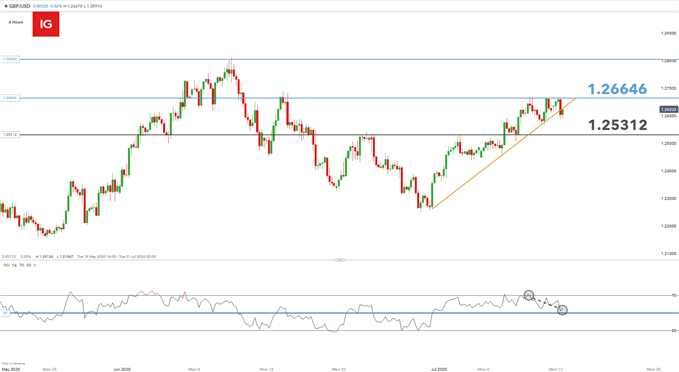
Chart prepared by Warren Venketas, IG
WILL Q3 RESOLVE THE TUG OF WAR CLASH BETWEEN BULLS AND BEARS?
This week’s US earnings season and key economic data announcements are likely to disturb current technical based forecasts so excluding these fundamentals factors may not be prudent in this scenario. Estimated Q2 earnings are forecasted to be record breaking with steep YoY declines. With the market expectant of these results, will the GBP/USD shift momentum from bullish to bearish?
IG CLIENT SENTIMENT DATA POINTS TO A CHANGE IN STIMULUS TO THE UPSIDE
IG Client Sentiment Data (IGCS) shows retail traders are currently noticeably short on GBP/USD, with 56% of traders currently holding short positions (as of this writing). At DailyFX we typically take a contrarian view to crowd sentiment, and the fact traders are net-short is suggestive of further upward momentum on the index.


