
GBP/JPY First Bullish Break Above 610 MA Since 2015
The GBP/JPY is close to breaking above the long-term moving average (610 ema) for the second time in the past weeks.
If successful, it would be the first serious break above the MA since the year 2015. It could finally indicate a larger uptrend on the daily chart. Let’s review.
Price Charts and Technical Analysis
(Click on image to enlarge)
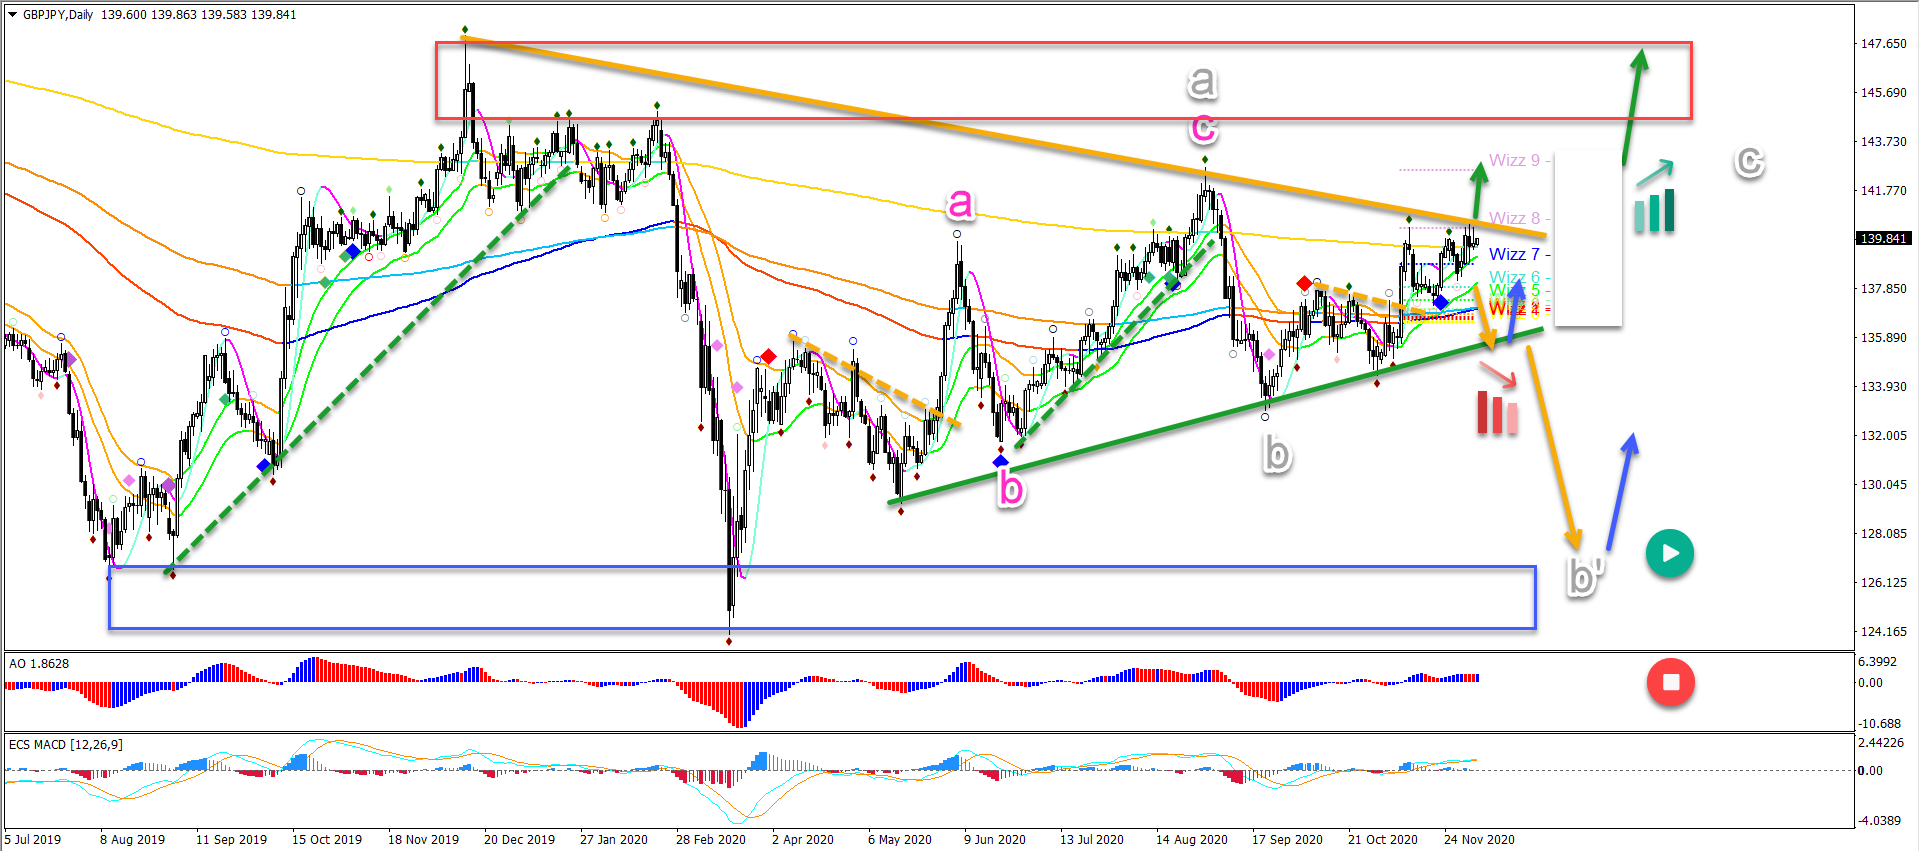
The GBP/JPY needs a break above the key resistance trend line (orange). A bullish breakout (green arrow) above 140-140.25 would confirm the uptrend.
The main targets are the Wizz 9 level at 142.50 and the resistance zone at the previous top (red box). In this case we are looking at a bullish wave C (grey).
What if a bearish break happens? This could indicate a retest of the support trend line (green). A break below that could indicate a deep wave B (grey), which could go to the previous bottom (blue box).
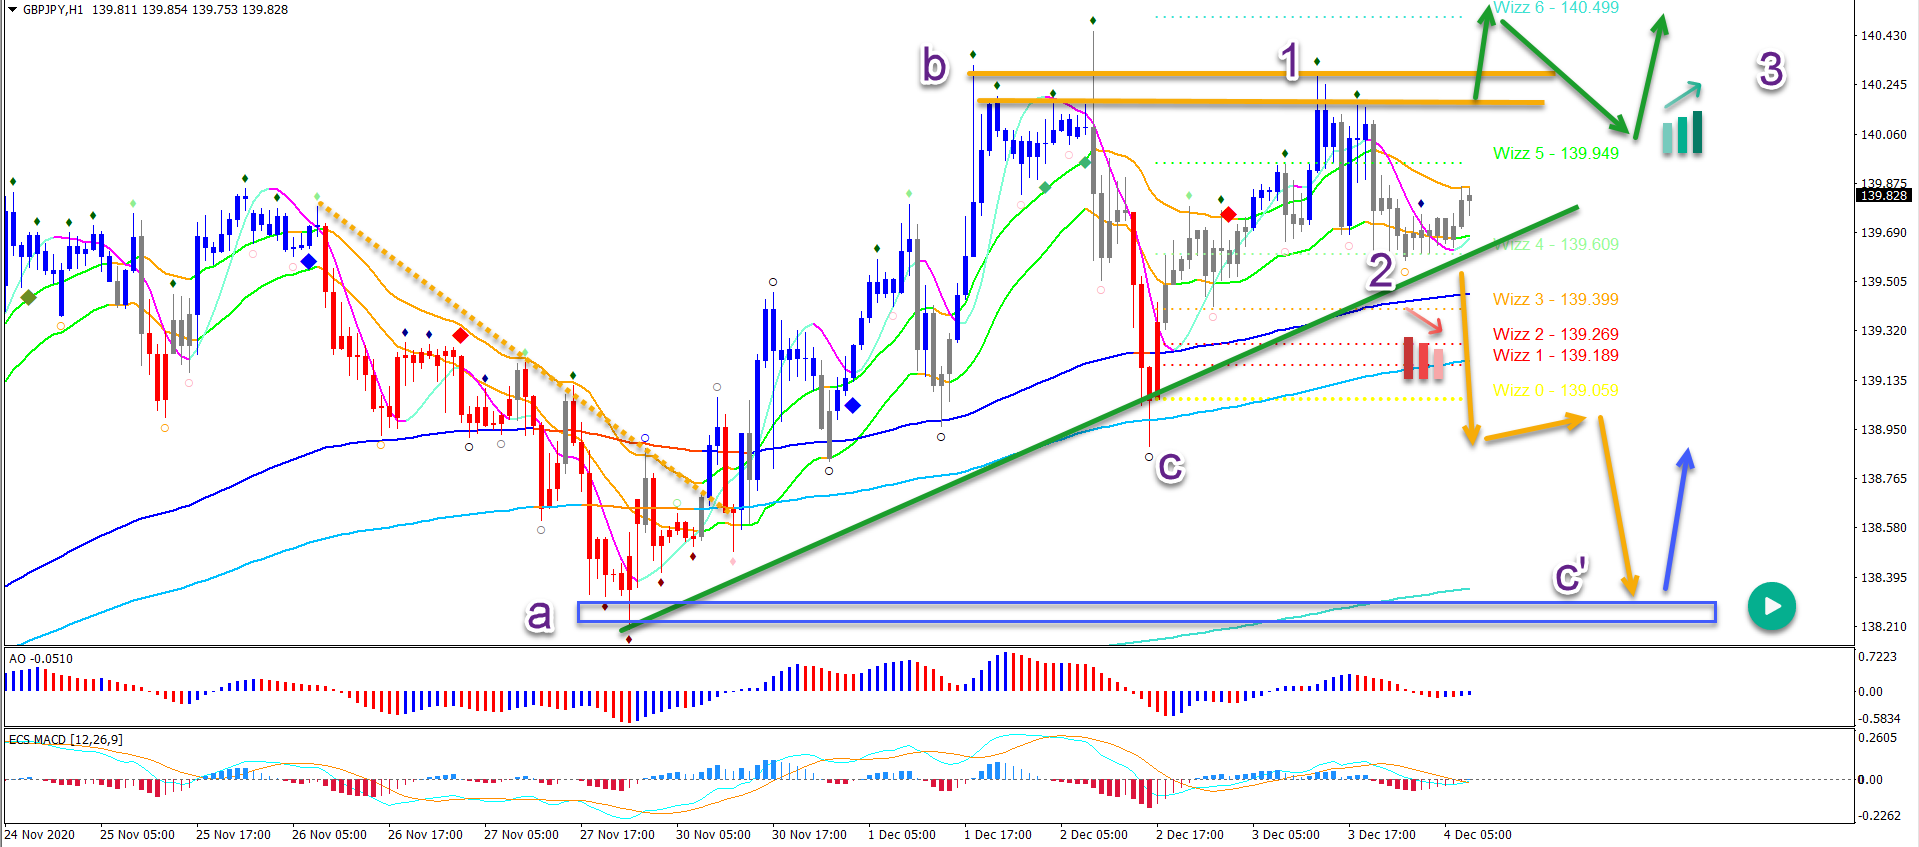
On the 1 hour chart, price action is waiting to breakout the top or the bottom. This could confirm a third price swing, either up or down.
The chart pattern is currently developing as an ascending wedge pattern, which is a bullish signal. In the bullish scenario, it would be a wave 3 (purple). For the bears, it’s an extended wave C (C’).
(Click on image to enlarge)
Disclaimer: The opinions in this article are for informational and educational purposes only and should not be construed as a recommendation to buy or sell the stocks mentioned or to solicit ...
more

