GBPCAD: Market Patterns Calling The Move Higher
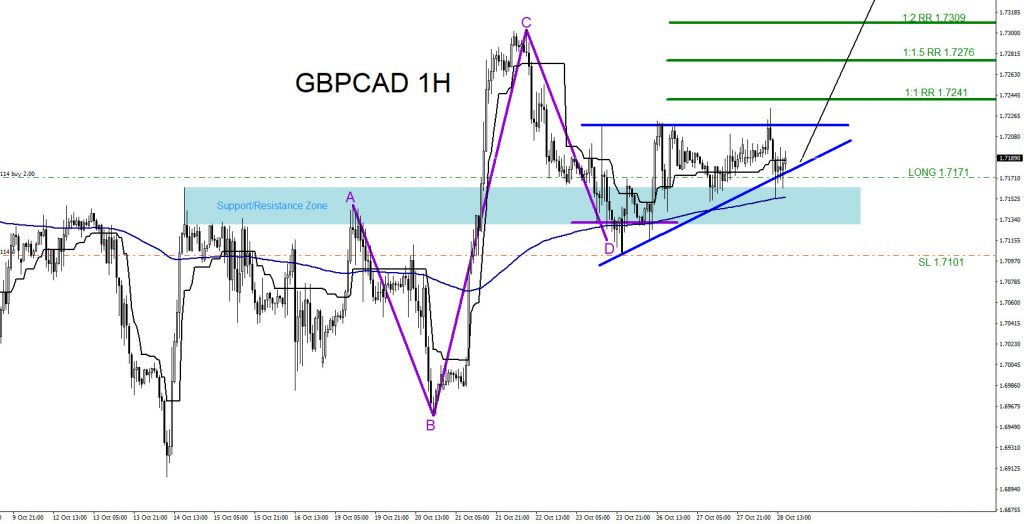
On October 27, I posted on social media: “GBPCAD - Watch for a move higher. Will be watching for possible buying opportunities.” The chart below shows that bullish market patterns were visible and were calling for a move higher. The Bullish Pattern (purple) triggered buyers at the BC 0.50% Fib. retracement level where the point D of the pattern terminated.
The purple bullish pattern also terminated at a key support/resistance zone (light blue) where price reacted with push higher. The price was also respecting and staying above the 200 moving average (dark blue), which was another signal that the pair could push higher.
Additionally, a bullish ascending triangle breakout pattern (blue) was forming, and a break above this triangle would send GBPCAD higher and hit the targets above it. These visible bullish patterns allowed me to call the move higher and look for buying opportunities.
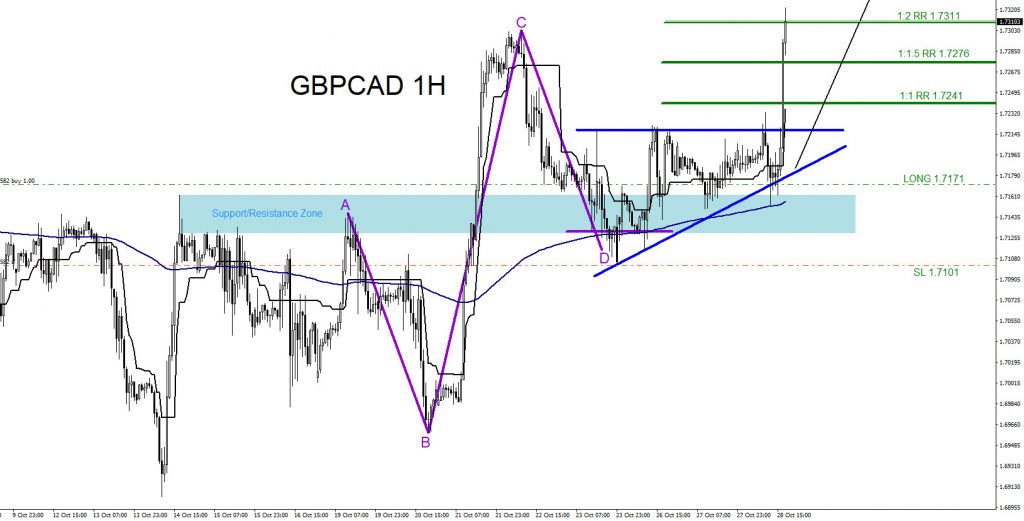
GBPCAD One-Hour Chart October 28, 2020
GBPCAD broke above the blue triangle, which caused more buyers to get in the market. This also pushed the pair higher, eventually hitting the 1:2 RR buy target at 1.7311 from my 1.7171 buy entry for +140 pips.
Like any strategy/technique, there will be times when the approach fails, so proper money/risk management should always be used on every trade.
Disclaimer: Futures, options, and over the counter foreign exchange products may involve substantial risk and may not be suitable for all investors. Leverage can work against you as well as for ...
more


