
Forex Metrics And Chart April 2018
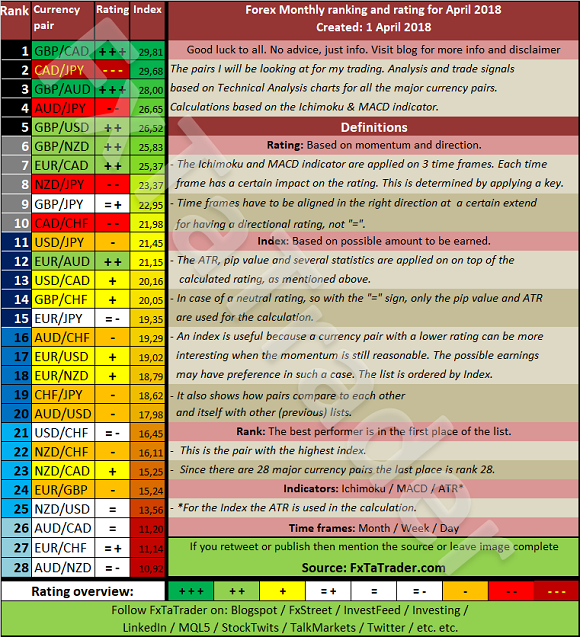
The Top 10 of the Ranking and Rating list for the coming month shows the following stronger currencies being well represented for going long: the GBP(5X) with the JPY(4X). The weaker currencies are the CAD(4X) followed by the AUD(2X) and the NZD(2X).
By diversifying a nice combination can be traded in the coming month like e.g.:
- CAD/JPY with the GBP/AUD
- GBP/CAD with the NZD/JPY
Ranking and Rating list
Analysis based on TA charts for all the major currency pairs. Every month the Forex ranking rating list will be prepared around the change of the month. All the relevant Time Frames will be analyzed and the ATR and Pip value will be set.
For analyzing the best pairs to trade looking from a longer-term perspective the last 12 months Currency Classification can be used in support.
This classification was updated on April 1, 2018 and is provided here for reference purposes:
Strong: EUR, GBP. The preferred range is from 7 to 8.
Neutral: CAD, CHF. The preferred range is from 5 to 6.
Weak: USD, JPY, AUD, NZD. The preferred range is 1 to 4.
When comparing the 12 months Currency Classification with the pairs mentioned in the Ranking List above some would then become less interesting. On the other hand, these pairs are at the top of the list partly also because of their volatility. It seems best to take positions for a short period then and take advantage of the high price movements.
With the FxTaTrader Strategy, these pairs are not traded because these would be trades in the 4 Hour chart or in a lower Time Frame. Nevertheless, they may offer good chances for the short term trader.
Currency Score Chart
The Currency Score analysis is one of the parameters used for the Ranking and Rating list which is published also in this article. The Currency Score is my analysis on the 8 major currencies based on the technical analysis charts using the MACD and Ichimoku indicator on 4 Time Frames: the monthly, weekly, daily and 4 hours. The result of the technical analysis is the screenshot here below.
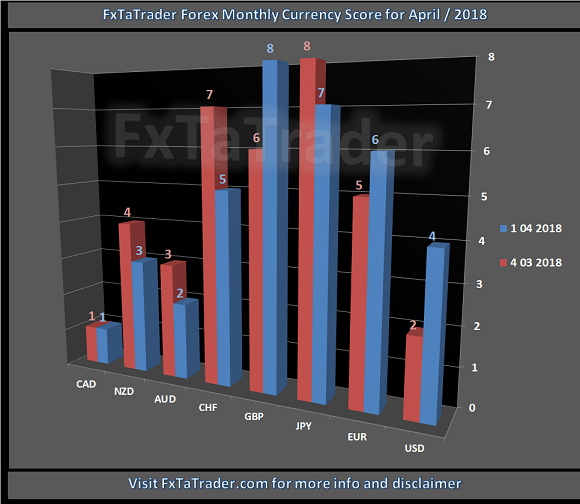
When comparing the 12 months Currency Classification with the recent Currency Score, as provided in the image above, we can determine the deviations. In the article "Forex Strength and Comparison" this is analyzed in more detail.
Chart of the Month
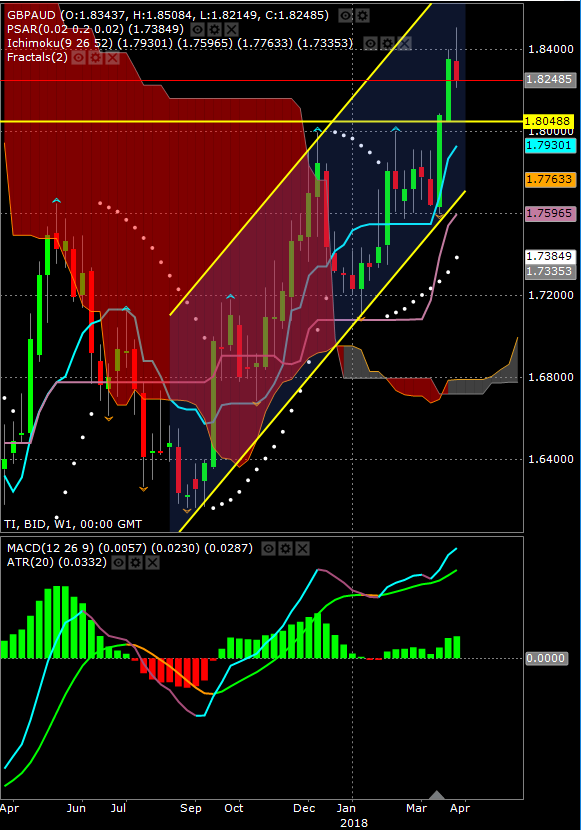
The Chart for this month is the GBP/AUD Weekly chart and the set-up is a Long Entry. Price is clearly in an uptrend and gaining momentum. Price broke a few months ago through an important resistance level, see the yellow dotted line, which is now a support. It may pull back to that support level and even towards the Tenkan-Sen in the coming period and this is a nice buy opportunity.
- For a good entry, by preference:
- The PSAR should be positive/negative in the Weekly chart, depending on the set-up. It should also be favorable for trades in the Daily chart in the direction of the set-up. It means that even if it is contrary at the moment the PSAR should show that trades in the direction of the set-up are making a better profit.
- The pullback has still to take place and price should be gaining momentum before entering positions.
- The candlesticks should show a good pattern that confirms the entry. This could be e.g. one of the reversal Candlesticks patterns or a continuation pattern. Check e.g. the following links for more information: Bulkowski's Top 10 Reversal Candlesticks ,Wikipedia Candlestick pattern or Investopedia Candlestick .
- The target should be, depending on the current set-up going long or short, below/above the latest high/low. This may be or become a resistance/support level and closing below/above that level is for that reason a good target.
- In case of a stronger pullback with price going far below/above the yellow dotted support line with the MACD not recovering the set-up is no more valid. A stop-loss should be placed below/above a recent top/bottom. These are levels where Resistance or Support may reside too.
- The MACD should show in the right direction strength in the MACD minus Signal, these are the Green and Red bars. In case of an uptrend, the green bars should be larger. In case of a downtrend, the red bars should become larger. The MACD should stay above/below the MACD Signal line and the zero line.
- This is a pair that fits best in Point 1 of the Comparison Table Guide. For more information read my other Monthly article called the "Forex Strength and Comparison" and the pages Explanation Articles.
- The GBP is a Strong currency and the AUD a Weak currency. The Currency Score Difference is 6.
The set-up mentioned remains valid as long as the pair remains in the Top 10 of the coming Monthly Ranking and Rating lists and continues to comply with the point of the Comparison Table Guide mentioned above.
Disclaimer: Besides this article I also use the Forex "Ranking, Rating and Score" which is also available once a week on my blog. In the article "Ranking, Rating and Score" ...
more

