
Forex Forecast: Pairs In Focus - Sunday, May 31
The difference between success and failure in Forex trading is very likely to depend upon which currency pairs you choose to trade each week, and not on the exact trading methods you might use to determine trade entries and exits. Of course, the current market environment is partly one of crisis, with price movements generally dominated by the economic impact of the coronavirus pandemic and the changed environment it has imposed upon monetary policies and trade. These are the dominant factors to consider in trading any market today.
Big Picture May 31
In my previous piece last week, I suggested several potential trades, but the only one which set up according to my conditions was going long of the S&P 500 Index following a daily close above 3000. We got such a close last Wednesday, and the price ended the week up by 0.26% from that entry point, so this was a profitable trade.
Last week’s Forex market saw the strongest rise in the relative value of the Canadian Dollar and the strongest fall in the relative value of the U.S. Dollar.
Fundamental Analysis & Market Sentiment
The world is not coming to an end, but we are living in an extraordinary time of global health crisis, the type of which has not been seen in one hundred years. There is both fear and optimism, but it is important to remember that the evidence shows that the vast majority of people are going to survive and be healthy.
Recent days have seen daily new confirmed coronavirus cases hit new all-time highs. This is a sign that globally, the wave of disease is not dying down yet.
We see the epicenter of the global coronavirus pandemic move into Latin America, with Brazil now starting to see more new deaths from the virus than any other country in the world. The rolling averages of deaths and new cases has finally begun to decrease significantly in the U.S.A. as a whole and in the U.K., which has recorded more deaths than any other country in Europe. European nations are beginning to relax restrictions, as is the U.S.A. in a patchy way.
Most OECD nations are now seemingly past the peak the of their first waves of coronavirus and have either begun to relax restrictions or are close to doing so. However, there is no guarantee that these relaxations will not quickly lead to second waves.
Latin America and the Caribbean are now responsible for approximately 40% of confirmed new daily deaths, with the U.S.A. at about 24% and Europe at barely more than 22%. Brazil has more total confirmed cases now than any other country except the U.S.A. The strongest exponential growth in new confirmed cases is happening in India, Brazil, Mexico, Peru, Pakistan, and Qatar. Despite this, India is beginning to relax restrictions.
The U.S. stock market rose again last week, closing above its 200-day moving average and the psychologically important round number at 3000. These are bullish signs for stock markets, suggesting that markets are somehow either setting aside the impact of the virus or believe the ultimate economic damage will be considerably less than has been supposed.
Headline economic data is bad. U.S. GDP shrank by an annualized 5% in the first quarter of 2020, while the comparable figure for Canada is 7.2% (better than had been expected by the market consensus). U.S. unemployment nationwide is currently confirmed at 14.7%. New unemployment claims in the U.S. have hit 50 million over only the past two months. Inflation is negative, at -0.8%. Some analysts still see this ongoing stock market rise as bound to collapse.
It is clear that as many countries seek to relax coronavirus-related restrictions to get their economies moving again, they will be hoping to be able to keep relaxing to try to secure strong economic rebounds. The only given is that employment and GDP generally will take severe hits, with Goldman Sachs forecasting a 34% drop in U.S. GDP in the second quarter of 2020. The stock market crash we have seen was comparable to 2008 and even 1929 so far. In fact, the speed of the initial drop of 20% from the all-time high price took only 15 market days to happen, compared to 30 days in 1929.
It has become clear that those countries which have fared best with their first waves of coronavirus are smaller nations such as Denmark, Norway, Greece, Austria, Denmark, Israel, and the Czech Republic. They are discussing creating a joint travel zone for commerce and tourism without quarantine.
Technical Analysis
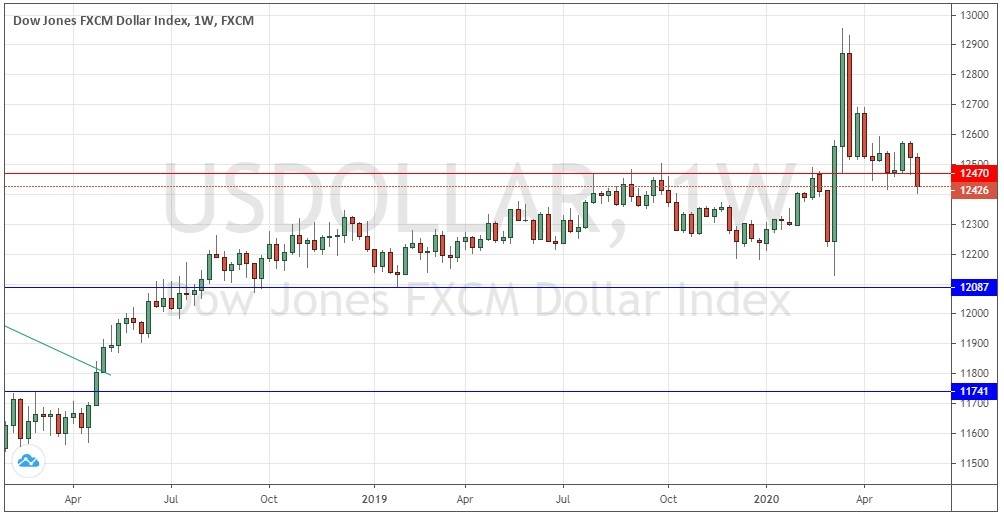
U.S. Dollar Index
The weekly price chart below shows last week printed a bearish candlestick which closed below the former support level at 12470 shown in the price chart below. There is still a long-term bullish trend reflected in the fact that the price is higher over both 3 and 6 months, but the breaching of support and the fact this trend barely exists anymore. Overall, next week’s price movement in the U.S. Dollar looks marginally likely to be downwards.
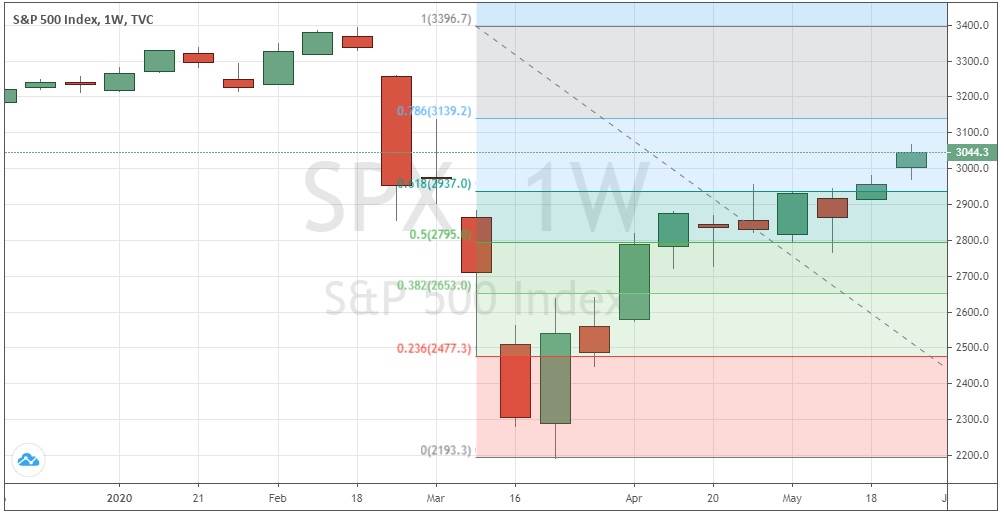
S&P 500 Index
The major U.S. stock market index the S&P 500 Index – the biggest market index in the world – rose last week and closed above its 200-day moving average and above the psychologically important round number at 3000.
The Index is somewhat likely to rise further over the coming week.
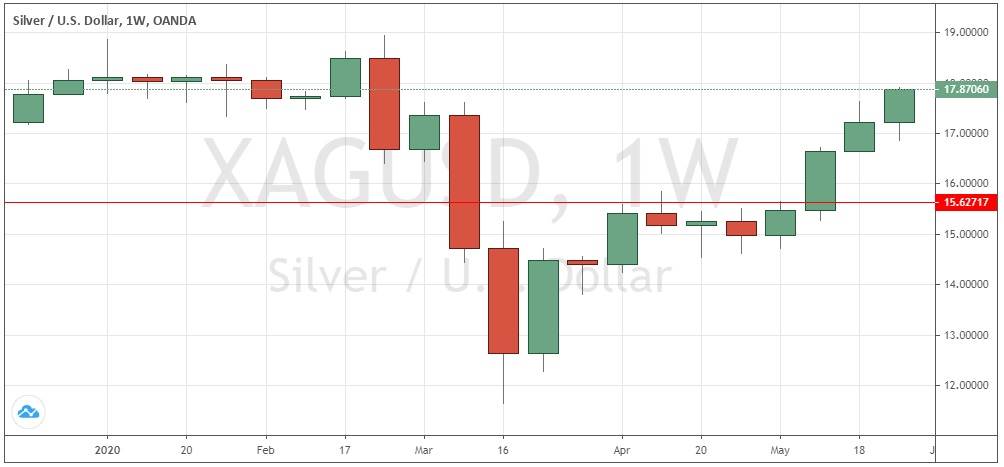
XAG/USD (Silver)
The Silver weekly chart has printed a firmly bullish candlestick which has broken to a new 50-day high price. We have a long-term bullish trend with the price above its levels from both 3 and 6 months ago. On Friday, the price closed very near the high of its weekly range. These factors all point to higher prices as likely to happen over the coming week.
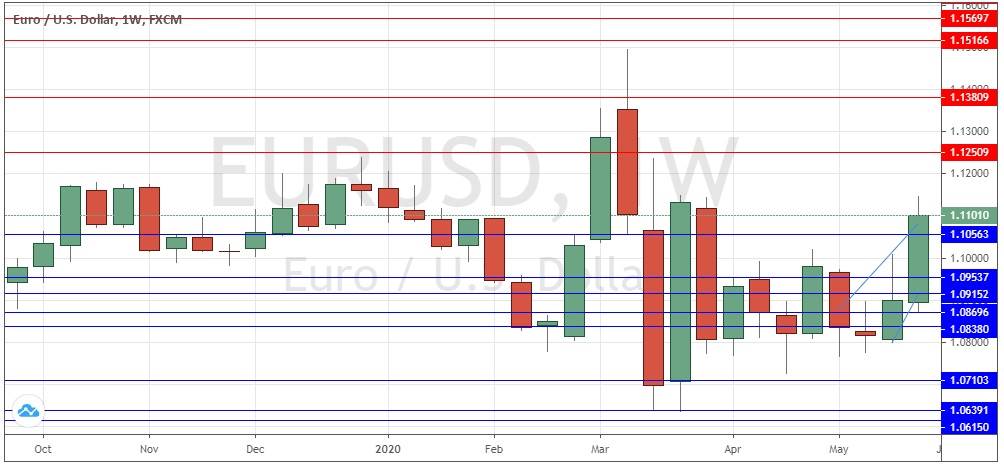
EUR/USD
We may be seeing the start of a long-term bullish breakout. It still has not happened yet, but if get a daily close above 1.1142 this week, a move to higher prices will be likely. We have a trend change from bearish to bullish as the price is now above its levels from both 3 and 6 months ago, but only barely.
Bottom Line
This week I forecast the best trades are likely to be:
- Long of Silver in U.S. Dollar terms.
- Long of EUR/USD following a daily (New York) close above 1.1142.
Disclaimer: DailyForex will not be held liable for any loss or damage resulting from reliance on the information contained within this website including market news, analysis, trading signals and ...
more

