Forex Forecast: Pairs In Focus - Sunday, May 16
The difference between success and failure in Forex trading is very likely to depend mostly upon which currency pairs you choose to trade each week and in which direction, and not on the exact trading methods you might use to determine trade entries and exits.
When starting the trading week, it is a good idea to look at the big picture of what is developing in the market as a whole and how such developments and affected by macro fundamentals and market sentiment.
It is a good time to be trading markets right now, as there are several valid long-term bullish trends in major U.S. stock market indices which can be traded at most Forex brokers as CFDs, as well as long-term bullish momentum in favor of the Canadian dollar, gold, and the euro against the U.S. dollar.
Big Picture May 16
Last week’s Forex market saw the strongest rise in the relative value of the British pound and the strongest fall in the relative value of the Japanese yen.
I wrote in my previous piece last week that the best trades were likely to be long of the S&P 500 Index, EUR/USD, and gold following a daily close above $1831, as well as short of the USD/CAD. The S&P 500 Index closed the week down by 1.29%, EUR/USD fell by 0.15%, the USD/CAD fell by 0.24%, while gold rose by 0.65%. This produced a small averaged loss of 0.14%.
Fundamental Analysis & Market Sentiment
The headline takeaway from last week was the surprisingly high U.S. inflation print released during the second half of the week, which showed annualized inflation in the U.S. currently running at 3%, a 25-year high. This rattled risk sentiment and we saw quite sharp falls in stock markets globally and in other risky assets, with the greenback benefiting from safe-haven flow. However, risk sentiment recovered quite strongly on Friday, with major stock indices rebounding strongly, while gold again closed at a new multi-month high daily closing price.
The main events this coming week will be releases of British and Canadian inflation data plus the Reserve Bank of Australia’s Monetary Policy Meeting Minutes.
Last week saw the global number of confirmed new coronavirus cases fall for the second week running, suggesting that the recent wave which saw a new record daily high may have peaked globally. Total confirmed coronavirus deaths also fell.
Despite the global dip, the coronavirus situation remains very serious in India, although new cases have fallen significantly there in recent days, suggesting this wave may have peaked.
Many countries have begun vaccination programs. Excepting extremely small nations, the fastest progress towards herd immunity has taken place in Israel, the U.K. and the U.A.E. Immunization is now proceeding more quickly in the European Union than it is in the U.S. although the U.S. is ahead of the E.U. with 46% of its population having received at least one shot of a vaccine, while the E.U. has vaccinated 31% of its population.
The strongest growth in new confirmed coronavirus cases right now is happening in Afghanistan, Argentina, Bahrain, Bolivia, Colombia, Costa Rica, Cuba, Denmark, Dominican Republic, Egypt, Georgia, Greece, Japan, Malaysia, Nepal, Paraguay, Sri Lanka, Trinidad, and Vietnam.
Technical Analysis
U.S. Dollar Index
The weekly price chart below shows the U.S. Dollar Index printed a bearish candlestick last week even though it closed slightly higher than its open. The index is still below its prices from both three and six months ago which is another a bearish sign. The greenback was boosted by much higher than anticipated U.S. inflation numbers last week, although the dollar lost considerable ground on Friday as risk appetite bounced back. Overall, next week’s price movement in the U.S. dollar looks likely to be downwards. For this reason, it will probably be wise to not take any long USD trades over the coming week.
S&P 500 Index
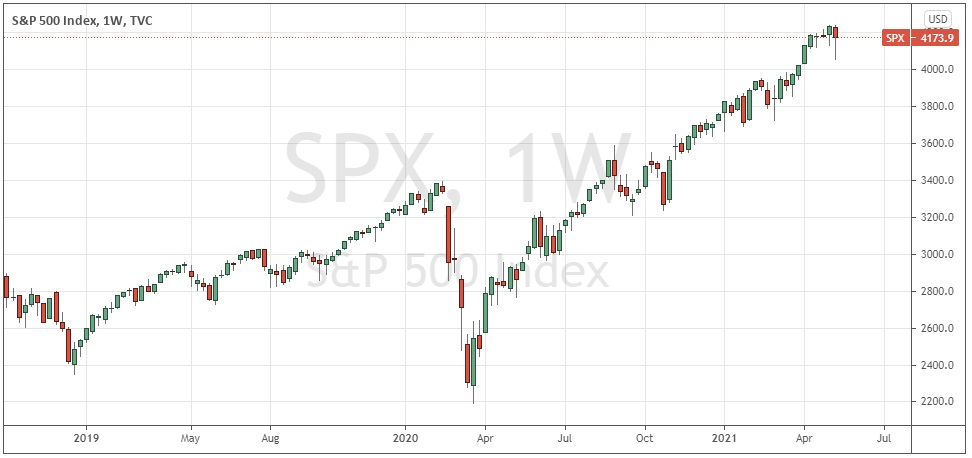
The incredible rise of the U.S. stock market since the initial impact of the coronavirus in March 2020 continues over the long term, with the price rallying strongly on Friday to recoup most of the losses from earlier in the week. However, the price is still well below recent all-time highs, so although the short-term odds are still slightly with the bulls, the advantage is only slight until the highs are broken, or until there is a deeper pullback which breaks below the 50-day moving average before turning bullish again.
USD/CAD
Although the Canadian dollar does not have a good track record of respecting its own price momentum, the chart below shows we have seen a firm and persistent long-term bullish trend in the Loonie ever since the initial recovery from the coronavirus price shock of March 2020. Last week again saw a bearish candlestick print which closed quite near the low of its range, with this currency pair now making a new 3.5-year low price. We can therefore say there is a strong long-term bearish trend although bears should be cautious of the big round number at 1.2000.
Gold
Gold again saw a firm advance during the second half of last week to reach a new 50-day high price on Friday. The price is now higher than it was 3 months ago which is normally a good measure of a bullish trend. Although the breakout here is not especially strong, gold does have a good historical record on the long side when it begins to break to new long-term highs.
Bottom Line
I see the best likely opportunities in the financial markets this week as being long of the S&P 500 Index, short of the USD/CAD currency pair, and long of gold in USD terms.
Disclaimer: DailyForex will not be held liable for any loss or damage resulting from reliance on the information contained within this website including market news, analysis, trading signals ...
more


