
EUR/USD Price Outlook: Euro To Struggle As US Economy Outperforms

EURO FORECAST: EUR/USD PRICE ACTION TO FACE HEADWINDS AMID BROAD US DOLLAR STRENGTH
- EUR/USD could snap back lower as resistance around the 1.2000-price level nears
- Euro weakness vs US Dollar might resume amid diverging yields, economic activity
The Euro has attempted to stabilize over recent trading sessions with EUR/USD price action catching a relief bounce off the 1.1860-level. This follows a stretch of selling pressure that sent EUR/USD tumbling roughly 500-pips off its early January swing high. Euro weakness against its US Dollar peer since the start of the year seems to largely track swings across sovereign bond yields.
EUR/USD TRACKING GERMAN BUND TO US TREASURY INTEREST RATE DIFFERENTIALS
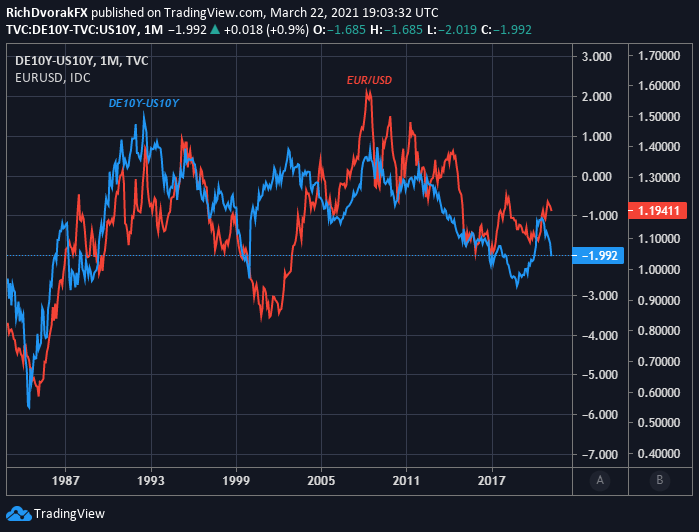
Chart by @RichDvorakFX created using TradingView
Looking at interest rate differentials between 10-year German Bunds and US Treasuries, for example, we can see the yield spread has collapsed by a whopping 50-basis points over the last three months. EUR/USD price action generally maintains a strong positive relationship with Bund to Treasury yield spreads as illustrated on the chart above. Surging US Treasury yields has coincided with massive fiscal spending packages, and the move has been exacerbated by improving economic outlook alongside a broadly successful covid vaccine rollout.
Meanwhile, the Eurozone has been grappling with a third wave of the coronavirus pandemic amid hiccups with its own vaccine rollout. The US vaccination rate is higher than that of the EU by about 1.3-million doses per day, which puts America on pace to vaccinate 75% of its population 13-months ahead of the Eurozone according to the latest data. Along with generally less restrictions on movement and economic activity, this has improved US GDP growth prospects, and relative to the EU in particular.
EUR/USD BEARISH Data provided by IG
| CHANGE IN | LONGS | SHORTS | OI |
| DAILY | 1% | -5% | -2% |
| WEEKLY | 23% | -13% | 4% |
What does it mean for price action?
Not to mention, the Federal Reserve has conveyed that it can stomach rising bond yields whereas the European Central Bank just increased its PEPP envelope to keep a lid on higher long-term interest rates. This all points to potential for the German Bund to US Treasury yield spread to continue moving lower, which could create more headwinds for EUR/USD price action going forward. This narrative might find support from the upcoming release of monthly PMI data scheduled to cross market wires later this week.
EUR/USD PRICE CHART: DAILY TIME FRAME (14 AUG 2020 TO 22 MAR 2021)
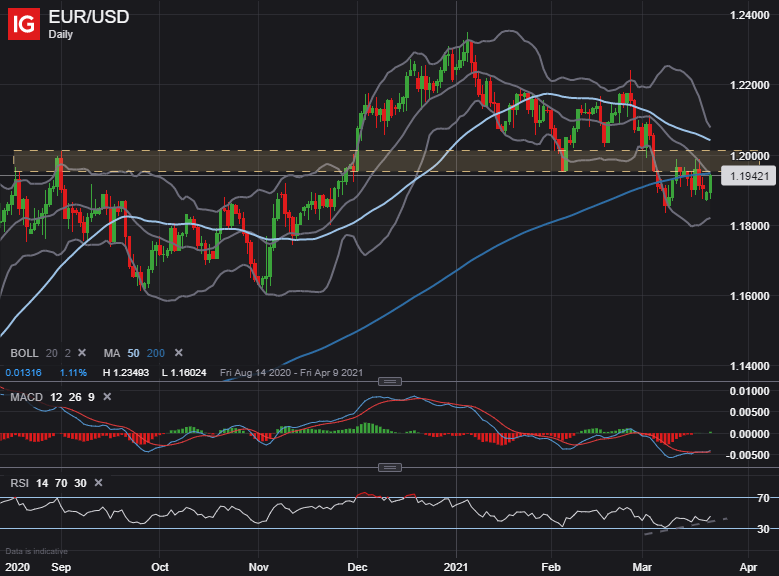
EUR/USD may have found some interim support near the 1.1860-price level, but it is worth noting that technical resistance looms large overhead. The 1.2000-handle, underscored by the August 2020 swing high and February 2021 swing low, stands out as a daunting obstacle for EUR/USD bulls.
Negatively-sloped 20-day and 50-day simple moving averages also look primed to exert downward pressure on EUR/USD price action. The relative strength index has crept higher over recent trading sessions, however, and a bullish MACD crossover just formed. This could provide EUR/USD bears with an opportunity to fade Euro strength with price action likely being contained between the upper and lower Bollinger Bands.
Disclosure: See the full disclosure for DailyFX here.


