
EUR/USD And Flatter Treasury Yield Curve
The EUR/USD pair recovered from the low of 1.1109 on Tuesday and now looks set to test November 2016 high of 1.13. The American dollar continues its retreat against most majors even though the Fed is pretty much set to hike rates in June.
What is it that is hurting the US dollar? The chart below shows the EUR/USD pair is inversely related to the difference between the yield on the 10-year Treasury note and the yield on the 2-year Treasury note (which represents the slope of the yield curve).
EUR/USD and Yield Curve comparison chart
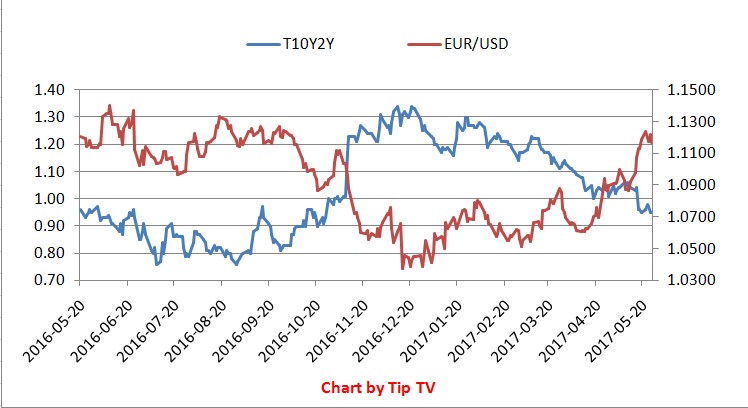
The yield curve steepened as the long run inflation expectations rose following an oil price recovery in Q2 2016 and rise in the Chinese PPI in mid/late 2016. Trump victory in November added fuel to the fire.
What it essentially means is that the EUR/USD has become more sensitive to the long duration treasury yields rather than the conventional US-German 2-year yield spread.
The yield curve steepening came to an end in late December 2016, while the EUR/USD bottomed out at 1.0341 on January 3, 2017.
The reflation trade fizzled out over the last few months... No wonder the yield curve has flattened i.e. the 10-year yield dropped more than the 2-year yield. Moreover, the Fed is still expected to deliver two more rate hikes this year and that seems to play its part in the flattening of the yield curve as well.
Outlook
- EUR/USD is likely to remain well bid so long as the long duration Treasury yields under perform the short-duration yields.
- The EUR side of the story would turn bearish if we have a resurgence of Greek debt crisis.
Disclosure: None.


