
Euro Technical Analysis: Losing Steam Ahead Of FOMC - Levels For EUR/GBP, EUR/JPY, EUR/USD
EURO NOT MAKING PROGRESS
Halfway through June, the Euro doesn’t have much to show for it. Although that may be the case around most of the major currencies in the acutely lower volatility environment, the fact of the matter is that several EUR-crosses entered the month with favorable technical setups – and nearly all have failed to capitalize on their tailwinds.
With the FOMC gathering this week for the June Federal Reserve policy meeting, it may be the case that each of the three major EUR-crosses is susceptible to a turn from recent trends. Indeed, with daily 21-EMAs being tested, a short-term inflection point may be nearing.
EUR/USD RATE TECHNICAL ANALYSIS: DAILY CHART (MARCH 2020 TO JUNE 2021) (CHART 1)
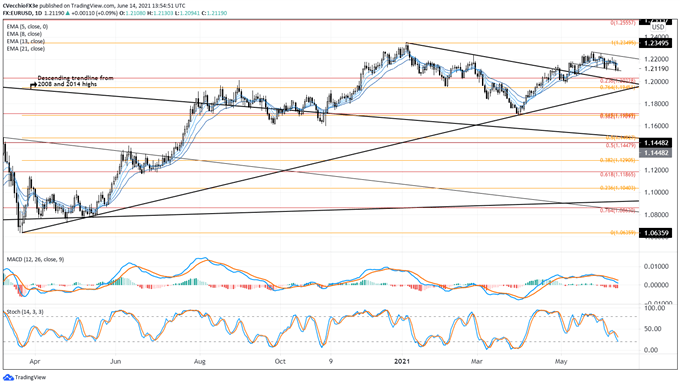
For now, EUR/USD rates are still holding above former consolidation resistance that defined price action starting in mid-April in what appears to be a bull flag (considering the preceding move was higher). But momentum continues to turn more bearish, with the pair below its daily 5-, 8-, 13-, and 21-EMA envelope, which is aligning into bearish sequential order. Daily MACD is falling while above its signal line (but nearing a sell signal), and daily Slow Stochastics are racing towards oversold territory.
While the current flagging pattern offers a defined range, a loss of support could see EUR/USD rates drop towards the 23.6% Fibonacci retracement of the 2020 low/2021 high range at 1.2033 before support is found anew.
IG CLIENT SENTIMENT INDEX: EUR/USD RATE FORECAST (JUNE 14, 2021) (CHART 2)
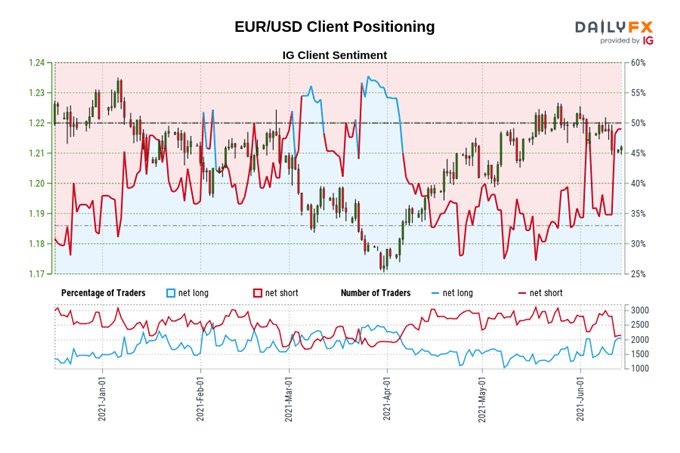
EUR/USD: Retail trader data shows 50.53% of traders are net-long with the ratio of traders long to short at 1.02 to 1. The number of traders net-long is 14.04% higher than yesterday and 50.99% higher from last week, while the number of traders net-short is 8.30% higher than yesterday and 19.54% lower from last week.
We typically take a contrarian view to crowd sentiment, and the fact traders are net-long suggests EUR/USD prices may continue to fall.
Traders are further net-long than yesterday and last week, and the combination of current sentiment and recent changes gives us a stronger EUR/USD-bearish contrarian trading bias.
EUR/JPY RATE TECHNICAL ANALYSIS: DAILY CHART (MARCH 2020 TO JUNE 2021) (CHART 3)
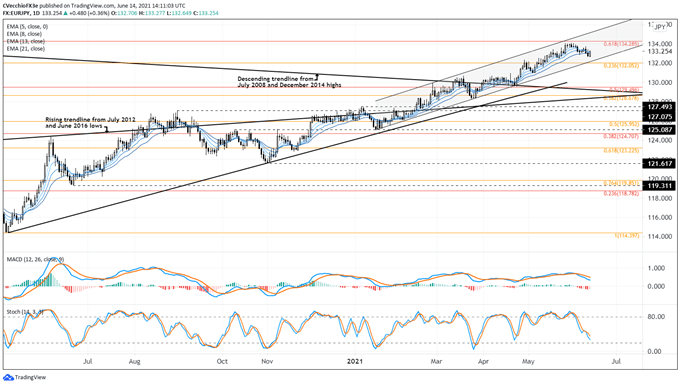
EUR/JPY rates hit a fresh yearly high at the start of June but have been on a steady decline since the first days of the month after failing to reach the 61.8% Fibonacci retracement of the 2014 high/2015 low range at 134.29. Even though momentum has waned – EUR/JPY rates are below their daily EMA envelope (which is in bearish sequential order), daily MACD is trending lower (albeit above its signal line still), and daily Slow Stochastics are close to reaching oversold territory – the technical structure remains bullish.
EUR/JPY rates remain within the ascending channel carved out since the start of the year, continuing to make progress higher after breaking out of the downtrend from the 2008 (all-time high) and 2014 highs back in April. Only would a loss of the 23.6% Fibonacci retracement of the 2018 high/2020 low range at 132.05 constitute a reason to believe that EUR/JPY weakness is anything other than a short-term occurrence.
IG CLIENT SENTIMENT INDEX: EUR/JPY RATE FORECAST (JUNE 14, 2021) (CHART 4)
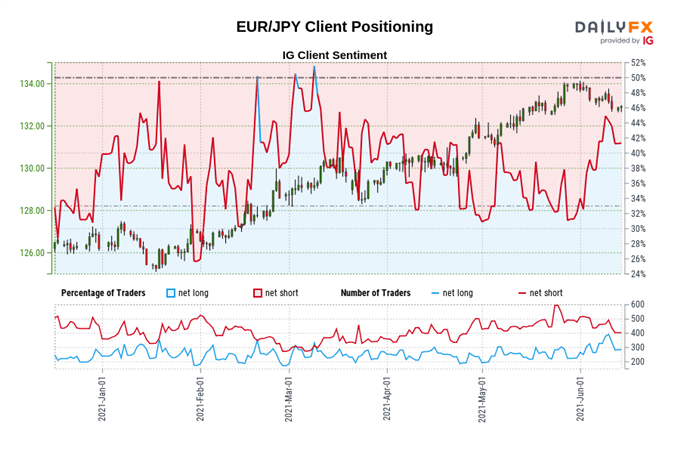
EUR/JPY: Retail trader data shows 44.44% of traders are net-long with the ratio of traders short to long at 1.25 to 1. The number of traders net-long is 21.13% higher than yesterday and 8.52% higher from last week, while the number of traders net-short is 5.13% higher than yesterday and 12.07% lower from last week.
We typically take a contrarian view to crowd sentiment, and the fact traders are net-short suggests EUR/JPY prices may continue to rise.
Yet traders are less net-short than yesterday and compared with last week. Recent changes in sentiment warn that the current EUR/JPY price trend may soon reverse lower despite the fact traders remain net-short.
EUR/GBP RATE TECHNICAL ANALYSIS: DAILY CHART (FEBRUARY 2020 TO JUNE 2021) (CHART 5)
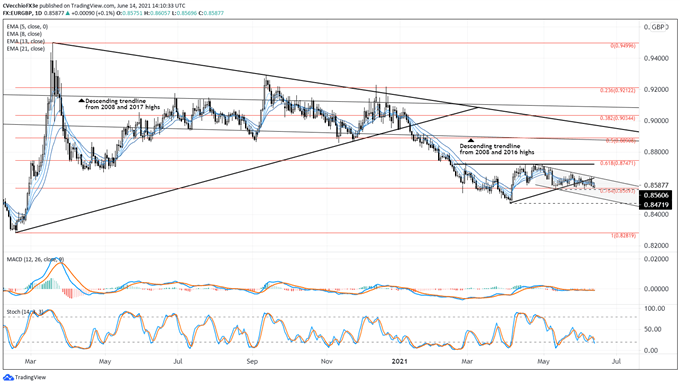
It’s been previously noted that “EUR/GBP rates have been trading into an ascending triangle, which suggests that more upside may be ahead over the next several weeks. However, the pair has extended the formation of its ascending triangle pattern, prolonging the consolidation. It may be the case that a right shoulder of an inverse head and shoulders pattern is being carved out; on the other hand, a break of the uptrend from the April and May swing lows would represent a continuation effort lower (given that the move preceding the consolidation was to the downside). It remains the case that more time needed before any decisive directional break can be determined…better opportunities may exist elsewhere.”
It now appears that the latter scenario – the break of the uptrend of the April and May lows, constituting an effort lower – is taking root. EUR/GBP rates have carved out a clearly defined descending channel since the start of May. But the past two weeks, there has been a noticeable lack of follow-through lower, insofar as the area between the May low at 0.8561 and the 76.4% Fibonacci retracement of the 2020 low/high range at 0.8569 has served as support. Losing this area (0.8561/69) would suggest that the next leg lower is imminent.
IG CLIENT SENTIMENT INDEX: EUR/GBP RATE FORECAST (JUNE 14, 2021) (CHART 6)
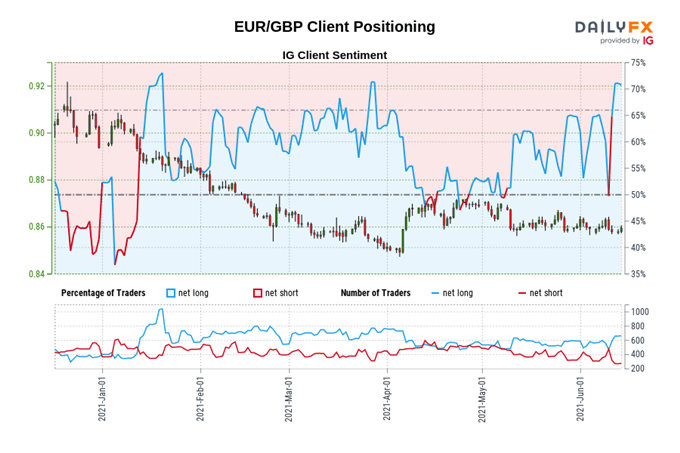
EUR/GBP: Retail trader data shows 66.88% of traders are net-long with the ratio of traders long to short at 2.02 to 1. The number of traders net-long is 4.37% lower than yesterday and 8.19% higher from last week, while the number of traders net-short is 15.02% higher than yesterday and 10.80% lower from last week.
We typically take a contrarian view to crowd sentiment, and the fact traders are net-long suggests EUR/GBP prices may continue to fall.
Positioning is less net-long than yesterday but more net-long from last week. The combination of current sentiment and recent changes gives us a further mixed EUR/GBP trading bias.


