
Euro Sinks On ECB: EUR/USD Fresh 2020 Lows, EUR/JPY Tests 121.00
It was another morning without much clarity from the ECB as new President Christine Lagarde settles into the top spot at the bank. Perhaps one of the biggest takeaways from this morning’s press conference was the announcement that the bank is looking to launch a review of their inflation policy, which would be the first since 2003.
Another item of interest and something to keep on eye on is the bank’s willingness to move head-first towards combatting climate change. Given the lack of precedence, it's difficult to know exactly what this might entail for ECB policy, particularly considering the continued struggle with slow/non-existent growth, lacking inflation and growing balance sheet.
The net impact of this morning’s rate decision was a fresh 2020 low in EUR/USD, although sellers haven’t yet had much room to run after testing below a big zone of well-weathered, confluent support.
EUR/USD DAILY PRICE CHART
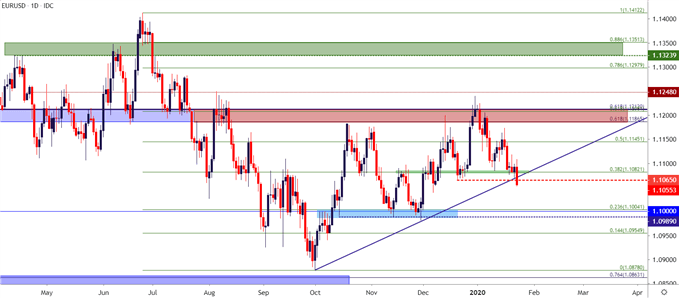
Chart prepared by James Stanley; EURUSD on Tradingview
Moving forward, bearish approaches could be complicated by a batch of support levels/zones sitting underneath current price action; key of which is the 1.1000 psychological level that came into play in November of last year before the pair launched up to fresh three-month-highs.
EUR/USD EIGHT-HOUR PRICE CHART
(Click on image to enlarge)
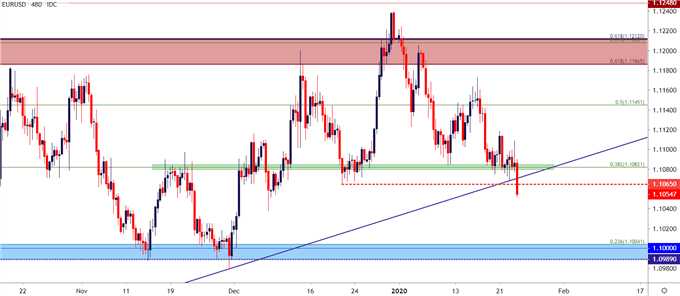
Chart prepared by James Stanley; EURUSD on Tradingview
EUR/JPY TRIPS DOWN TO 121.00
As looked at in this week’s forecast on the Euro, the bearish backdrop in EUR/JPY was a bit clearer given that there’d been some actual trends showing of recent. While EUR/USD has spent the better part of the past few months gyrating within a range (and thus earning a neutral forecast), EUR/JPY launched-higher in early-2020 trade to set a fresh five-month-high, just under the 123.00 level, soon finding resistance. This opened the door for bearish biases in the pair, and sellers have so far taken-control of the matter there.
Resistance showed up via a bearish trendline that was established in March and April of last year, and this level helped to hold the highs last week and sellers began to swing this week, quickly reversing much of that prior bullish trend.
At this point, support potential is nearing via a bullish trendline projection. Below that, the 120 psychological level looms large as this price helped to set support in early-December; and was soundly defended by bulls in the opening days of 2020 trade.
EUR/JPY DAILY PRICE CHART
(Click on image to enlarge)
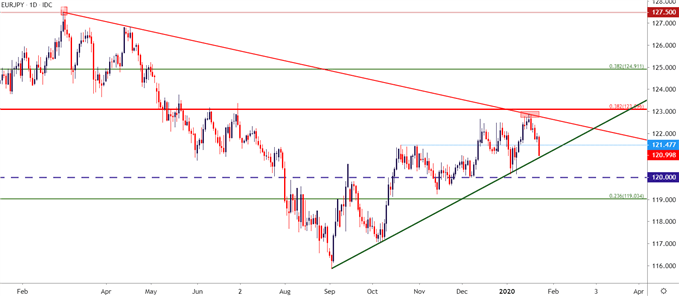
Chart prepared by James Stanley; EURJPY on Tradingview


