
Euro Rallies For 4 ½ Months, Breaks Out Of 12-Year Trend Line, And Runs Into 17-Year Resistance
The euro just broke out of a falling trend line from April 2008. It has rallied the past four and a half months, pushing the daily and weekly in particular into overbought territory. In the futures market, non-commercials, in the meantime, are the most optimistic ever. Amidst this, the currency is sending out signs of fatigue, having been denied last week at 17-year horizontal resistance.
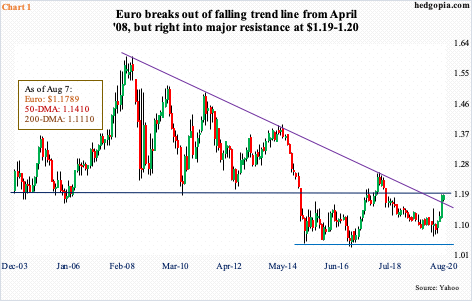
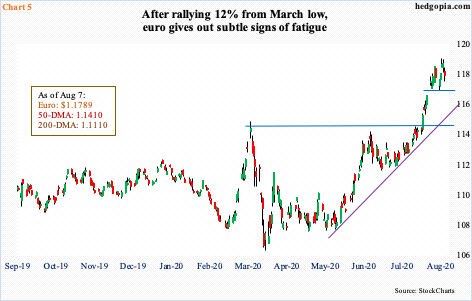
The euro reached an important low on March 20 at $1.064. In the next four and a half months through last Wednesday’s high of $1.191, it rallied 12 percent, which is a lot in the currency land.
Late last month, the euro broke out of a falling trend line from April 2008 when it peaked at $1.602 (Chart 1). The currency built on it further last week before bumping against potentially major resistance at $1.19-1.20. At Wednesday’s high, it was up 1.2 percent for the week but was unable to hang on to the gains, ending the week up 0.1 percent.
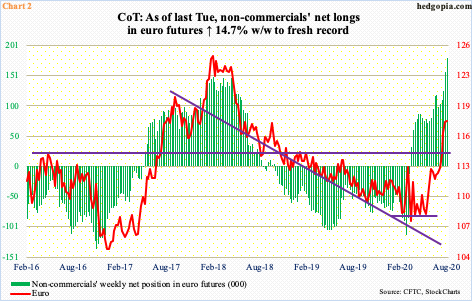
Non-commercials adeptly rode the recent rally in the euro.
After remaining net short euro futures since October 2018, they switched to net long in the week ended March 17. In fact, through the middle of April 2018, they were net long 151,476 contracts, before beginning to cut back. The euro was in the process of peaking back then. On the 25th that month, it hit $1.254 and then pretty much went sideways for three months before suffering a rug pull. The currency kept going lower until the aforementioned March low. It went sideways for three months before making a sustained move higher in May. Non-commercials, already firmly net long, kept adding.
The April 2018 high was surpassed two weeks ago, to a new record. Last week, yet another record was made (Chart 2). Non-commercials are now net long 180,648 contracts, which have gone parabolic the last three weeks, pricing in a lot of optimism.
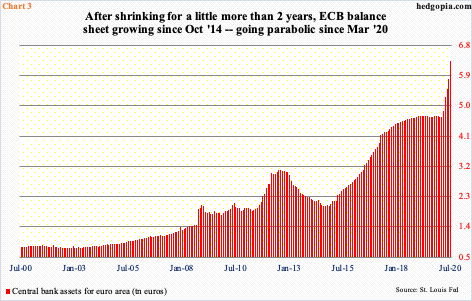
The euro’s recent rally comes in the midst of massive expansion in the European Central Bank’s balance sheet. At the end of July, it held €6.33 trillion in assets, up €1.64 trillion in five months. The balance sheet has been growing since October 2014, having bottomed at €2.01 trillion in September that year. But it has absolutely gone parabolic for five months through July (Chart 3).
The balance sheet now makes up 53 percent of euro area GDP, versus 36 percent at the Fed using 2Q20 nominal GDP. The euro area also has rate disadvantage over the US. In its July meeting, the ECB left its monetary policy unchanged, maintaining the refinancing rate unchanged at zero percent and the deposit rate at a record low minus 0.5 percent. The fed funds rate, too, is zero-bound between zero and 25 basis points but remains in positive territory.
With that said, the euro may be benefiting from rising investor perception that a fiscal union will happen eventually.
Last month, the European Union authorized €750 billion in borrowing in order to fight off the Covid-19 recession. Time will tell, but this could be the beginning of a major policy change. In the euro zone, monetary decisions are made by the ECB, but most decisions about taxes and spending are made by each participating country. In other words, there is monetary union, but not fiscal.
A fiscal union – or progress toward that goal – potentially is a major fundamental catalyst for the euro. Improved sentiment thereof likely resulted in July’s technical breakout.
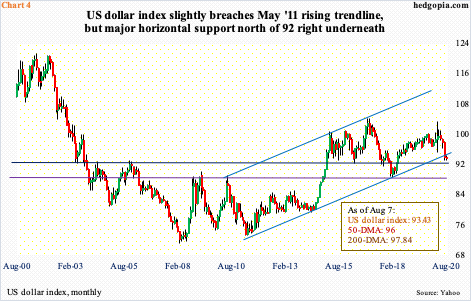
Also last month, even as the euro was breaking out, the US dollar index (93.43) was breaking down. Two weeks ago, a rising trend line from May 2011, when the index bottomed at 72.70, was breached. Last Monday’s intraday high of 93.98 was then rejected at the underside of that broken support (Chart 4).
From dollar bulls’ perspective, the good thing is that support just north of 92 is holding. Six sessions ago, the US dollar index tagged 92.52. This was followed by last Monday’s rally attempt, which was stopped at the 10-day, resulting in a shooting star session. Tuesday, the average again came in the way, but only to give way Friday, albeit slightly. This was preceded by Thursday’s doji session with a low of 92.50. Horizontal support just north of 92 goes back at least 17 years.
On the weekly, last week’s long-legged doji was preceded by a hammer. This raises the odds the US dollar index stabilizes around here. Inability to do so makes it vulnerable to a test of 88-89. Otherwise, odds of a relief rally – magnitude and duration notwithstanding – are rising.
The euro makes up 57.6 percent of the US dollar index. A rally in the latter will obviously reverberate through the former.
As mentioned earlier, the euro ($1.179) itself is at a crucial juncture. After the aforementioned trend-line breakout two weeks ago, last Monday’s early weakness was bought at the sharply rising 10-day, which was again defended Tuesday. Wednesday’s intraday high of $1.191 then proceeded to test horizontal resistance at $1.19-1.20, which goes back to May 2003.
Less than five months ago – on March 20, to be specific – the euro bottom-ticked $1.064. Conditions are extended, daily and weekly in particular. On the weekly, the last couple of weeks produced candles with long upper shadows, even as the RSI surpassed 70 last Thursday – the first time this has happened since January 2018, when it was in the process of reversing lower (Chart 1).
Nearest support lies at $1.17, followed by trend-line support at $1.16 (Chart 5). Then there is 1.145, which also approximates the 50-day at $1.141. This assumes resistance at $1.19-1.20 holds.
Thanks for reading!


