EUR/JPY At Long Term Symmetrical Triangle
The Japanese yen has been extremely strong in recent months and weeks. The bounce from long-term support in all Japanese yen correlated pairs was simply a normal occurrence. EURJPY and USDJPY are expected to fall further in the coming weeks and months. In this section, we will look at the monthly, weekly, and daily charts of EURJPY. Let’s begin by taking a look at the EURJPY long-term monthly chart.
EURJPY Monthly Chart
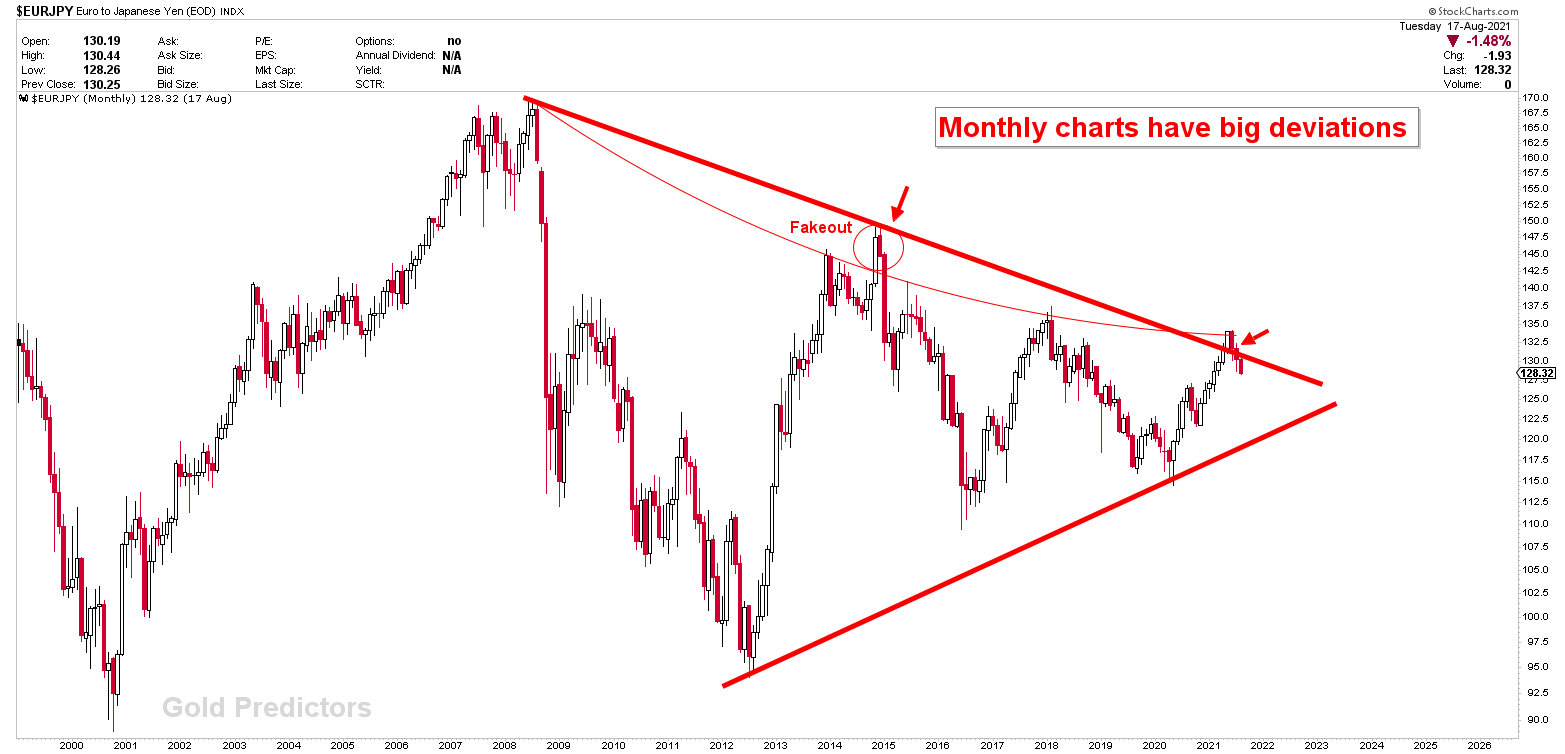
The EURJPY monthly chart shows that the instrument is capped within the symmetrical triangle. The resistance here indicates that prices are about to fall sharply. When price surpassed the triangle line, we stated that this is normal behavior and that prices would return back to the triangle. Prices are currently trading within the triangle, and once the summer doldrums pass, they are expected to fall sharply.
(Click on image to enlarge)

EURJPY Weekly Chart
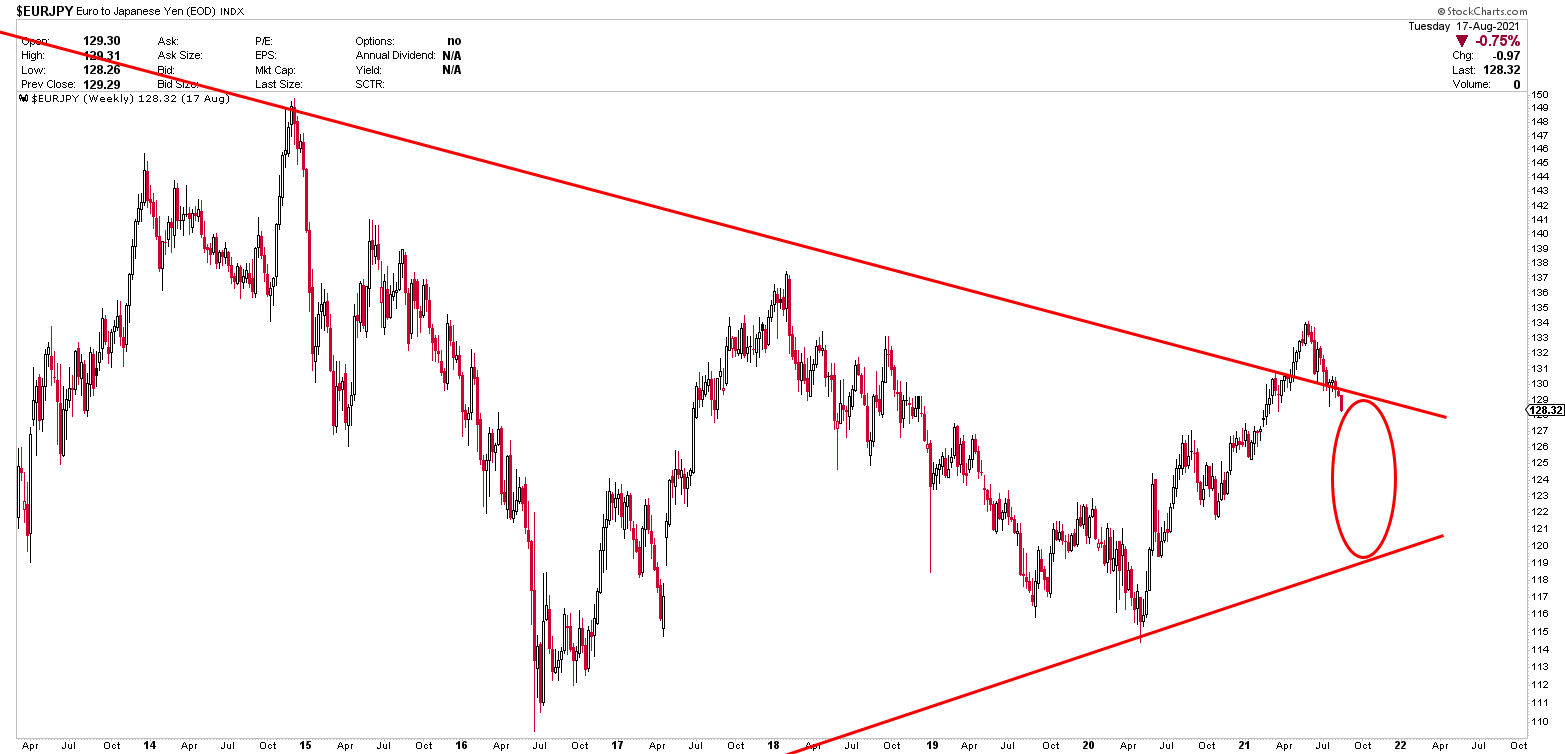
The weekly chart is a zoomed-in version of the monthly EURJPY chart. The symmetrical triangle is clearly visible in this chart, and the weekly candle appears to be falling. Last week was a coiling week, which indicates the accumulation of energy. This stored energy appears to be releasing to the downside. However, there is strong support on the weekly and daily charts, which could push prices higher before the next breakdown.
(Click on image to enlarge)

Daily Charts Trades At Neckline
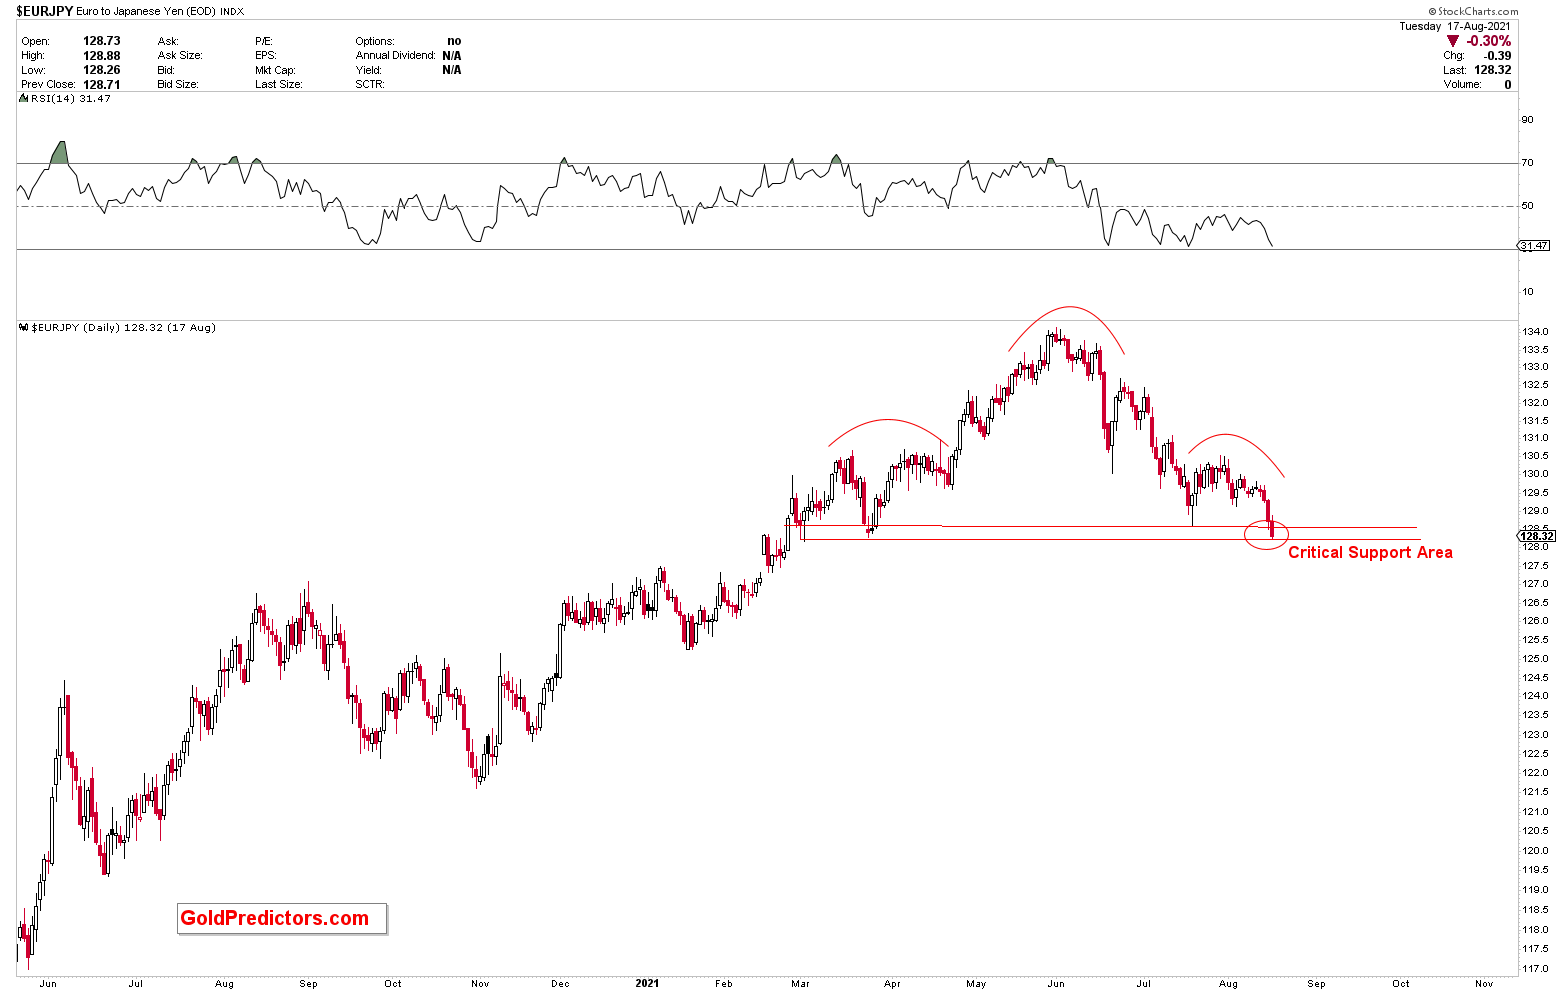
The daily chart shows the head and shoulder formations. It shows that prices are trading near the neckline of the head and shoulder. A break in this neckline will almost definitely set off a powerful move. However, based on the monthly and weekly charts, any bounce from this level appears to generate strong resistance to the downside.
(Click on image to enlarge)

The above discussion presents the EURJPY outlook using monthly, weekly, and daily charts. It illustrates that monthly charts present long-term resistances and prices are likely to break down. Whereas daily charts present strong support at the neckline. A break of this neckline will initiate the next leg to the downside.
Disclaimer: Articles/Short-term & Long-term Trading signals/Newsletters distributed by GoldPredictors.com has no regard to the specific investment objectives, financial situation or the ...
more


