
DAX 30, FTSE 100 & CAC 40 Forecasts For The Week Ahead
DAX 30, FTSE 100 & CAC 40 FORECASTS FOR THE WEEK AHEAD
Risk appetite has wavered after the recent Fed minutes release and equity markets have started to tilt lower as a result. Still, losses are modest at the moment and the market conditions brought about by the summer doldrums may undermine conviction in the event of a technical break. With that in mind, the major European indices could remain ensnared in their current technical formations.
DAX 30 FORECAST
In the case of the DAX 30, recent losses have allowed price to probe an ascending trendline from May that looks to be at its breaking point. While a move lower would seriously erode the trendline’s influence, I am hesitant to suggest a break would spark drastic declines, but it could see the DAX 30 slip into a range similar to that of the FTSE 100 and CAC 40.
DAX 30 PRICE CHART: 4 - HOUR TIME FRAME (MAY 2020 – AUGUST 2020)
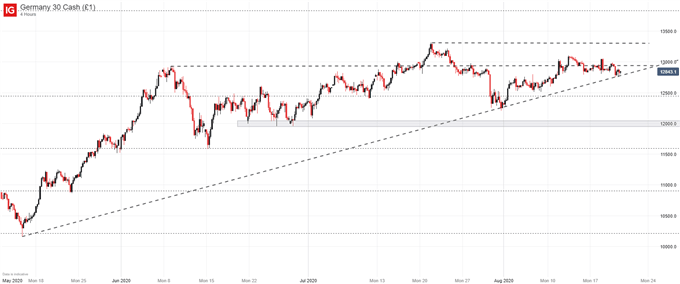
To that end, a continuation lower may encounter resistance at the Fibonacci level around 12,500, but mounting an aggressive move beyond could be difficult in the current climate. On the other hand, a recovery rally would likely be quite timid in nature and it would have to negotiate resistance slightly beneath the 13,000 mark.
FTSE 100 FORECAST
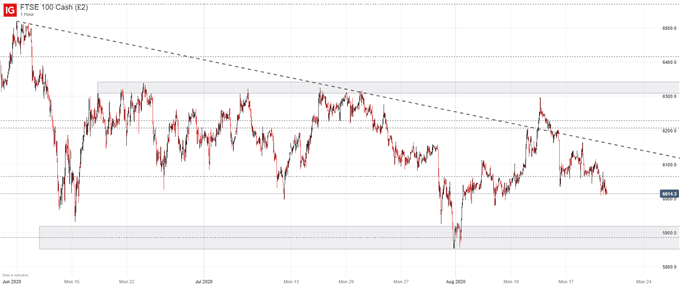
After surging on the back of better than expected GDP data last week, the FTSE 100 has since forfeited gains after encountering resistance at the 6,300 mark. The strong-arm rejection suggests the index is still trapped in the trading range between 6,300 and 5,900, allowing for range trading opportunities. Thus, a continued decline to the supportive band beneath could allow for an attractive entry point for long exposure if the range continues to hold.
FTSE 100 PRICE CHART: 1 – HOUR TIME FRAME (JUNE 2020 – AUGUST 2020)
CAC 40 FORECAST
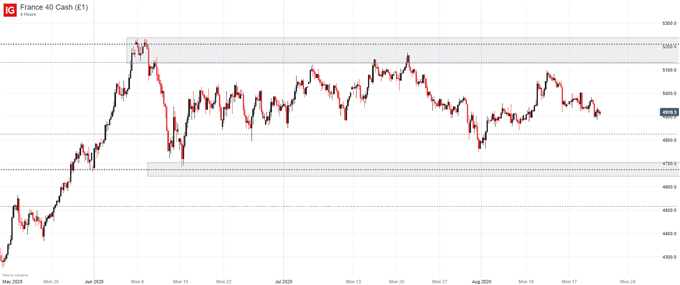
Like the FTSE 100, the CAC 40 is exhibiting symptoms of range-bound price action. Lacking major catalysts, market activity and nearby technical levels of note, it seems there is little reason to suggest a sudden change in trend for the CAC 40. Therefore, range traders can look to capitalize on the upper and lower boundaries if price attempts to break out.
CAC 40 PRICE CHART: 4 – HOUR TIME FRAME (MAY 2020 – AUGUST 2020)
All in all, the DAX 30 may slip into a range of its own while the FTSE 100 and CAC 40 are exhibiting little indication that break outs are on the horizon. Consequently, traders can probably expect more of the same in the days ahead until a fundamental catalyst arrives or major technical levels are threatened. Evidently, the summer doldrums are in full swing as price action languishes about at the height of the season.


