
Here are the latest charts and statistics for the Commitment of Traders (COT) data published by the Commodities Futures Trading Commission (CFTC).
The latest COT data is updated through Tuesday, June 14th and shows a quick view of how large traders (for-profit speculators and commercial entities) were positioned in the futures markets.
COT bond market speculator bets were mixed as five out of the eight bond markets we cover had higher positioning this week while three markets had falling speculator contracts for the week.
Leading the gains for the bond markets was the Eurodollar (791,810 contracts) and the 10-Year Bond (60,658 contracts) with Fed Funds (56,698 contracts), 5-Year Bond (31,476 contracts) and the 2-Year Bond (10,067 contracts) also showing positive weeks.
Meanwhile, leading the declines in speculator bets this week were the Long US Bond (-34,363 contracts) and the Ultra US Bond (-26,628 contracts) with the Ultra 10-Year (-5,373 contracts) also seeing lower bets on the week.
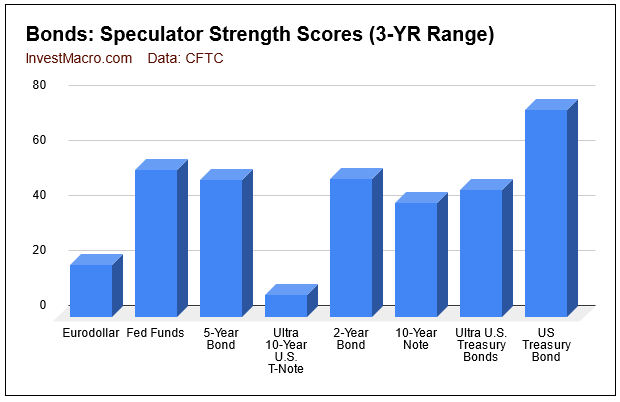
Strength scores (3-Year range of Speculator positions, from 0 to 100 where above 80 is extreme bullish and below 20 is extreme bearish) show that the US Treasury Bond (75 percent) is at the highest level of the bonds markets currently. On the lower end, the Ultra 10-Year Bonds (7.7 percent) and 3-Month Eurodollars (15.4 percent) are in bearish-extreme levels and have the weakest speculator strength scores at the moment.
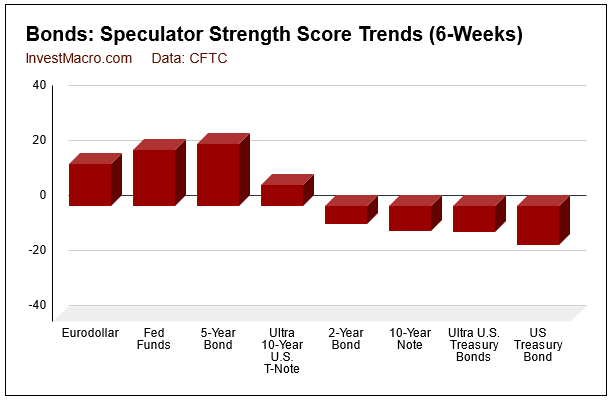
Strength score trends (or move index, that calculate 6-week changes in strength scores) shows that the 5-Year Bond (22.5 percent) and Fed Funds (20.5 percent) are leading the rising trend scores over the past six weeks. The US Treasury Bond leads the trends on the downside with a -9.2 percent trend change followed by the 10-Year Bonds and Ultra 10-Year Bonds.
Data Snapshot of Bond Market Traders | Columns Legend
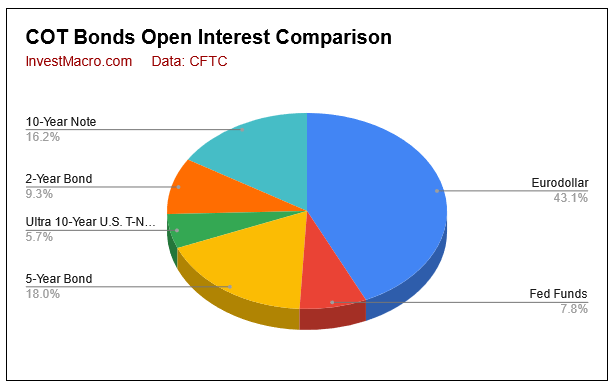
| Eurodollar | 9,327,824 | 9 | -1,854,692 | 19 | 2,223,303 | 81 | -368,611 | 23 |
| 5-Year | 3,889,422 | 45 | -191,071 | 50 | 372,681 | 59 | -181,610 | 31 |
| 10-Year | 3,509,639 | 30 | -205,529 | 41 | 374,018 | 66 | -168,489 | 40 |
| 2-Year | 2,012,004 | 10 | -160,422 | 50 | 228,211 | 70 | -67,789 | 20 |
| FedFunds | 1,680,512 | 52 | 110,931 | 53 | -115,511 | 46 | 4,580 | 71 |
| Long T-Bond | 1,188,806 | 47 | -29,400 | 75 | 43,870 | 32 | -14,470 | 41 |
3-Month Eurodollars Futures:
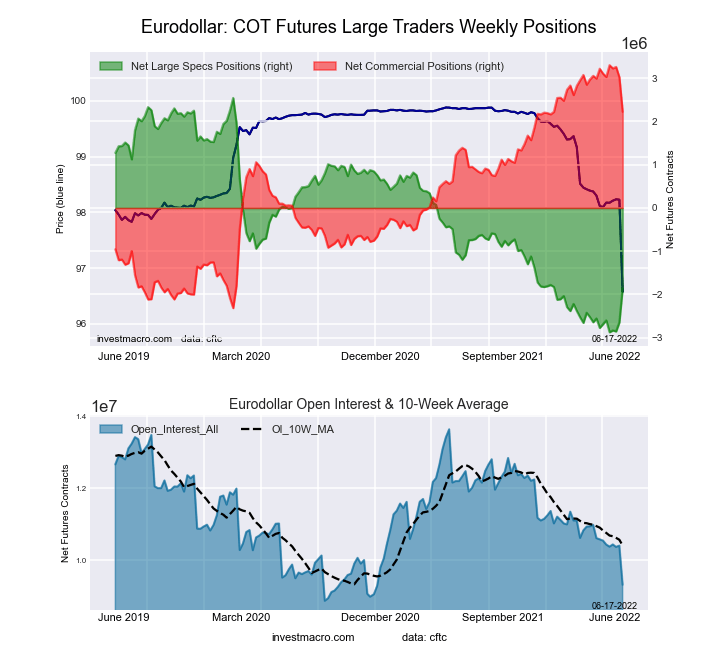
The 3-Month Eurodollars large speculator standing this week recorded a net position of -1,854,692 contracts in the data reported through Tuesday. This was a weekly lift of 791,810 contracts from the previous week which had a total of -2,646,502 net contracts.
This week’s current strength score (the trader positioning range over the past three years, measured from 0 to 100) shows the speculators are currently Bearish-Extreme with a score of 18.8 percent. The commercials are Bullish-Extreme with a score of 80.8 percent and the small traders (not shown in chart) are Bearish with a score of 23.3 percent.
| 3-Month Eurodollars Statistics | SPECULATORS | COMMERCIALS | SMALL TRADERS |
| – Percent of Open Interest Longs: | 7.0 | 68.9 | 4.4 |
| – Percent of Open Interest Shorts: | 26.9 | 45.1 | 8.4 |
| – Net Position: | -1,854,692 | 2,223,303 | -368,611 |
| – Gross Longs: | 651,750 | 6,428,169 | 412,783 |
| – Gross Shorts: | 2,506,442 | 4,204,866 | 781,394 |
| – Long to Short Ratio: | 0.3 to 1 | 1.5 to 1 | 0.5 to 1 |
| NET POSITION TREND: | |||
| – Strength Index Score (3 Year Range Pct): | 18.8 | 80.8 | 23.3 |
| – Strength Index Reading (3 Year Range): | Bearish-Extreme | Bullish-Extreme | Bearish |
| NET POSITION MOVEMENT INDEX: | |||
| – 6-Week Change in Strength Index: | 15.4 | -15.7 | 11.1 |
30-Day Federal Funds Futures:
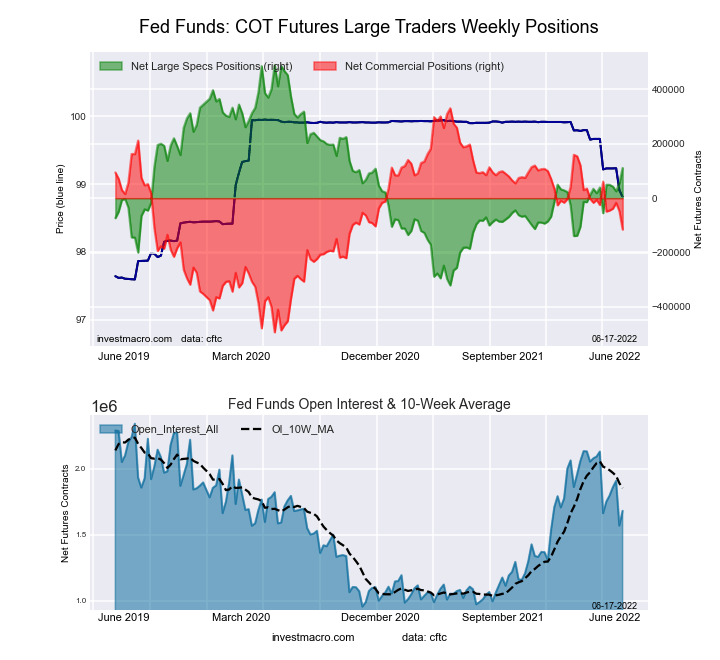
The 30-Day Federal Funds large speculator standing this week recorded a net position of 110,931 contracts in the data reported through Tuesday. This was a weekly advance of 56,698 contracts from the previous week which had a total of 54,233 net contracts.
This week’s current strength score (the trader positioning range over the past three years, measured from 0 to 100) shows the speculators are currently Bullish with a score of 53.3 percent. The commercials are Bearish with a score of 45.9 percent and the small traders (not shown in chart) are Bullish with a score of 71.3 percent.
| 30-Day Federal Funds Statistics | SPECULATORS | COMMERCIALS | SMALL TRADERS |
| – Percent of Open Interest Longs: | 13.2 | 70.8 | 2.8 |
| – Percent of Open Interest Shorts: | 6.6 | 77.6 | 2.5 |
| – Net Position: | 110,931 | -115,511 | 4,580 |
| – Gross Longs: | 221,596 | 1,189,101 | 46,737 |
| – Gross Shorts: | 110,665 | 1,304,612 | 42,157 |
| – Long to Short Ratio: | 2.0 to 1 | 0.9 to 1 | 1.1 to 1 |
| NET POSITION TREND: | |||
| – Strength Index Score (3 Year Range Pct): | 53.3 | 45.9 | 71.3 |
| – Strength Index Reading (3 Year Range): | Bullish | Bearish | Bullish |
| NET POSITION MOVEMENT INDEX: | |||
| – 6-Week Change in Strength Index: | 20.5 | -21.4 | 25.1 |
2-Year Treasury Note Futures:
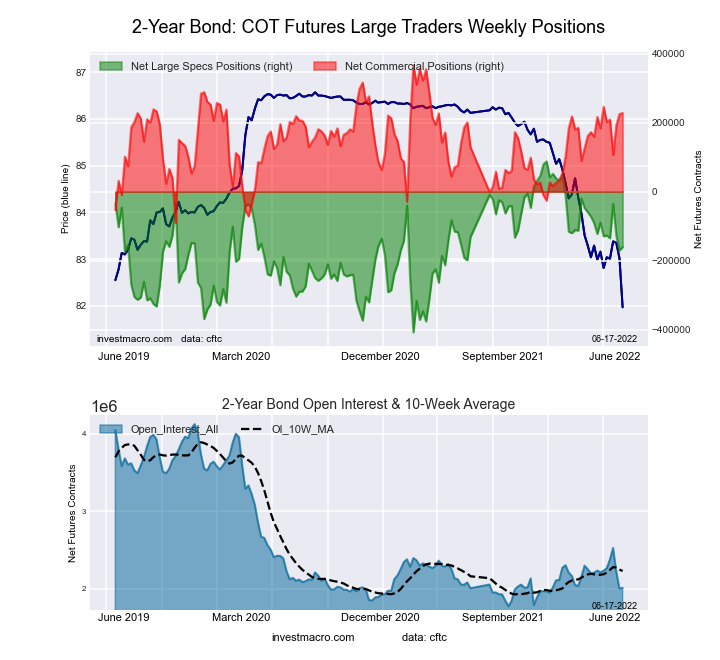
The 2-Year Treasury Note large speculator standing this week recorded a net position of -160,422 contracts in the data reported through Tuesday. This was a weekly gain of 10,067 contracts from the previous week which had a total of -170,489 net contracts.
This week’s current strength score (the trader positioning range over the past three years, measured from 0 to 100) shows the speculators are currently Bearish with a score of 49.9 percent. The commercials are Bullish with a score of 69.7 percent and the small traders (not shown in chart) are Bearish with a score of 20.3 percent.
| 2-Year Treasury Note Statistics | SPECULATORS | COMMERCIALS | SMALL TRADERS |
| – Percent of Open Interest Longs: | 11.7 | 77.3 | 7.1 |
| – Percent of Open Interest Shorts: | 19.7 | 65.9 | 10.5 |
| – Net Position: | -160,422 | 228,211 | -67,789 |
| – Gross Longs: | 236,115 | 1,554,892 | 143,727 |
| – Gross Shorts: | 396,537 | 1,326,681 | 211,516 |
| – Long to Short Ratio: | 0.6 to 1 | 1.2 to 1 | 0.7 to 1 |
| NET POSITION TREND: | |||
| – Strength Index Score (3 Year Range Pct): | 49.9 | 69.7 | 20.3 |
| – Strength Index Reading (3 Year Range): | Bearish | Bullish | Bearish |
| NET POSITION MOVEMENT INDEX: | |||
| – 6-Week Change in Strength Index: | -6.3 | -3.8 | 20.3 |
5-Year Treasury Note Futures:
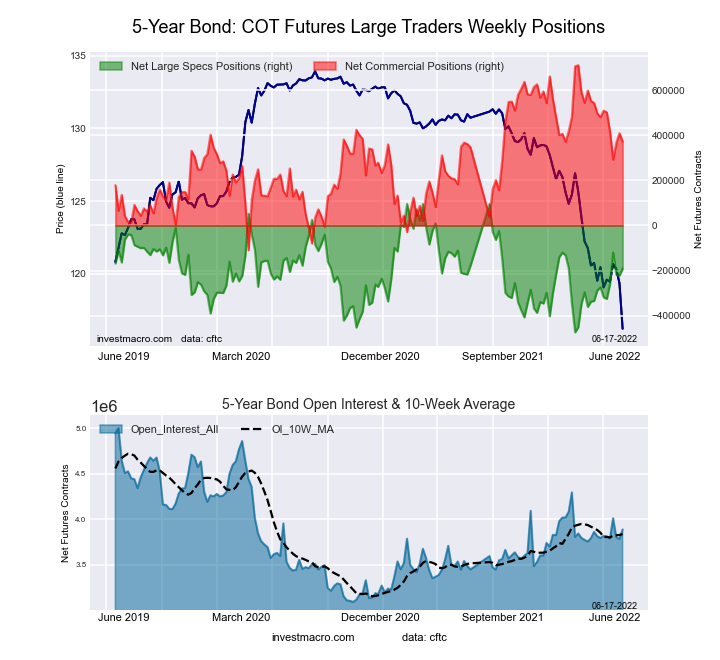
The 5-Year Treasury Note large speculator standing this week recorded a net position of -191,071 contracts in the data reported through Tuesday. This was a weekly advance of 31,476 contracts from the previous week which had a total of -222,547 net contracts.
This week’s current strength score (the trader positioning range over the past three years, measured from 0 to 100) shows the speculators are currently Bearish with a score of 49.7 percent. The commercials are Bullish with a score of 58.8 percent and the small traders (not shown in chart) are Bearish with a score of 31.1 percent.
| 5-Year Treasury Note Statistics | SPECULATORS | COMMERCIALS | SMALL TRADERS |
| – Percent of Open Interest Longs: | 9.6 | 80.8 | 7.8 |
| – Percent of Open Interest Shorts: | 14.5 | 71.2 | 12.5 |
| – Net Position: | -191,071 | 372,681 | -181,610 |
| – Gross Longs: | 374,601 | 3,141,449 | 302,708 |
| – Gross Shorts: | 565,672 | 2,768,768 | 484,318 |
| – Long to Short Ratio: | 0.7 to 1 | 1.1 to 1 | 0.6 to 1 |
| NET POSITION TREND: | |||
| – Strength Index Score (3 Year Range Pct): | 49.7 | 58.8 | 31.1 |
| – Strength Index Reading (3 Year Range): | Bearish | Bullish | Bearish |
| NET POSITION MOVEMENT INDEX: | |||
| – 6-Week Change in Strength Index: | 22.5 | -16.7 | 2.5 |
10-Year Treasury Note Futures:
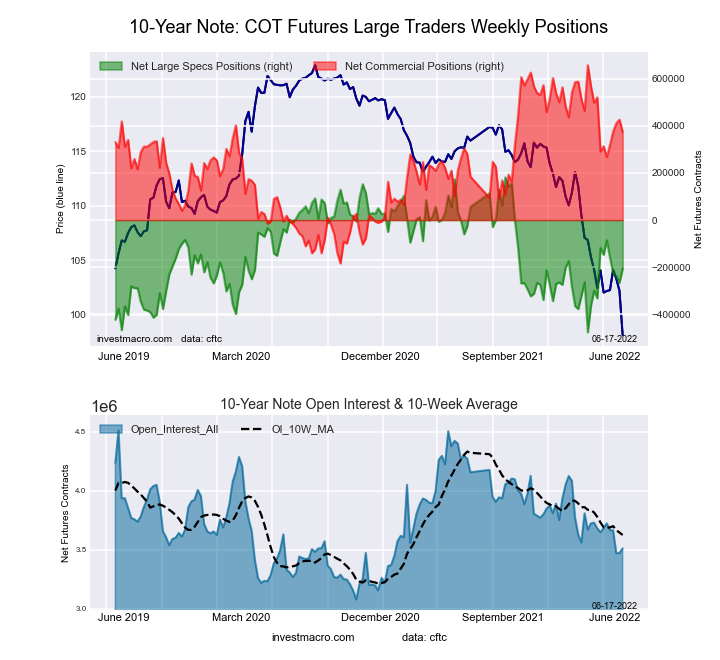
The 10-Year Treasury Note large speculator standing this week recorded a net position of -205,529 contracts in the data reported through Tuesday. This was a weekly lift of 60,658 contracts from the previous week which had a total of -266,187 net contracts.
This week’s current strength score (the trader positioning range over the past three years, measured from 0 to 100) shows the speculators are currently Bearish with a score of 41.2 percent. The commercials are Bullish with a score of 66.3 percent and the small traders (not shown in chart) are Bearish with a score of 39.8 percent.
| 10-Year Treasury Note Statistics | SPECULATORS | COMMERCIALS | SMALL TRADERS |
| – Percent of Open Interest Longs: | 7.2 | 80.3 | 8.7 |
| – Percent of Open Interest Shorts: | 13.1 | 69.7 | 13.5 |
| – Net Position: | -205,529 | 374,018 | -168,489 |
| – Gross Longs: | 253,485 | 2,819,950 | 305,184 |
| – Gross Shorts: | 459,014 | 2,445,932 | 473,673 |
| – Long to Short Ratio: | 0.6 to 1 | 1.2 to 1 | 0.6 to 1 |
| NET POSITION TREND: | |||
| – Strength Index Score (3 Year Range Pct): | 41.2 | 66.3 | 39.8 |
| – Strength Index Reading (3 Year Range): | Bearish | Bullish | Bearish |
| NET POSITION MOVEMENT INDEX: | |||
| – 6-Week Change in Strength Index: | -8.8 | 7.2 | -0.6 |
Ultra 10-Year Notes Futures:
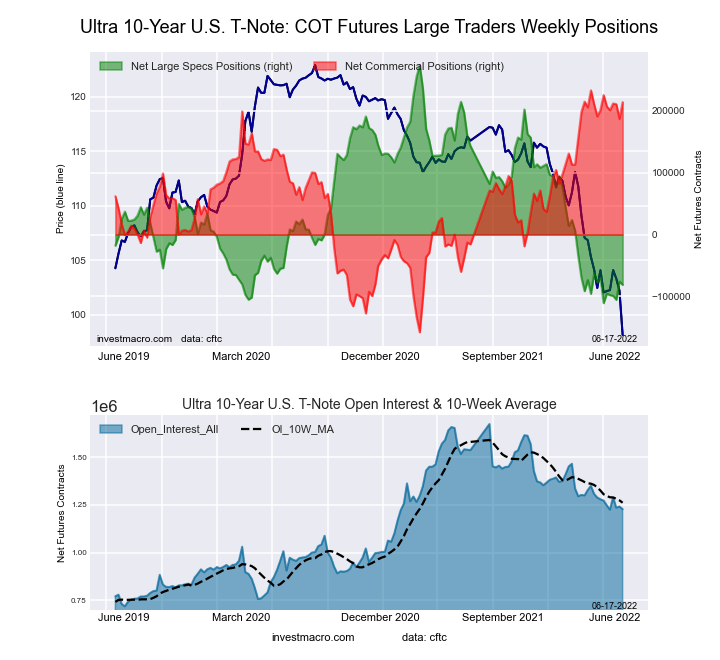
The Ultra 10-Year Notes large speculator standing this week recorded a net position of -81,207 contracts in the data reported through Tuesday. This was a weekly fall of -5,373 contracts from the previous week which had a total of -75,834 net contracts.
This week’s current strength score (the trader positioning range over the past three years, measured from 0 to 100) shows the speculators are currently Bearish-Extreme with a score of 7.7 percent. The commercials are Bullish-Extreme with a score of 95.2 percent and the small traders (not shown in chart) are Bearish with a score of 36.7 percent.
| Ultra 10-Year Notes Statistics | SPECULATORS | COMMERCIALS | SMALL TRADERS |
| – Percent of Open Interest Longs: | 4.5 | 83.7 | 11.0 |
| – Percent of Open Interest Shorts: | 11.1 | 66.2 | 21.8 |
| – Net Position: | -81,207 | 213,971 | -132,764 |
| – Gross Longs: | 55,047 | 1,027,514 | 134,825 |
| – Gross Shorts: | 136,254 | 813,543 | 267,589 |
| – Long to Short Ratio: | 0.4 to 1 | 1.3 to 1 | 0.5 to 1 |
| NET POSITION TREND: | |||
| – Strength Index Score (3 Year Range Pct): | 7.7 | 95.2 | 36.7 |
| – Strength Index Reading (3 Year Range): | Bearish-Extreme | Bullish-Extreme | Bearish |
| NET POSITION MOVEMENT INDEX: | |||
| – 6-Week Change in Strength Index: | 7.7 | -2.9 | -11.3 |
US Treasury Bonds Futures:
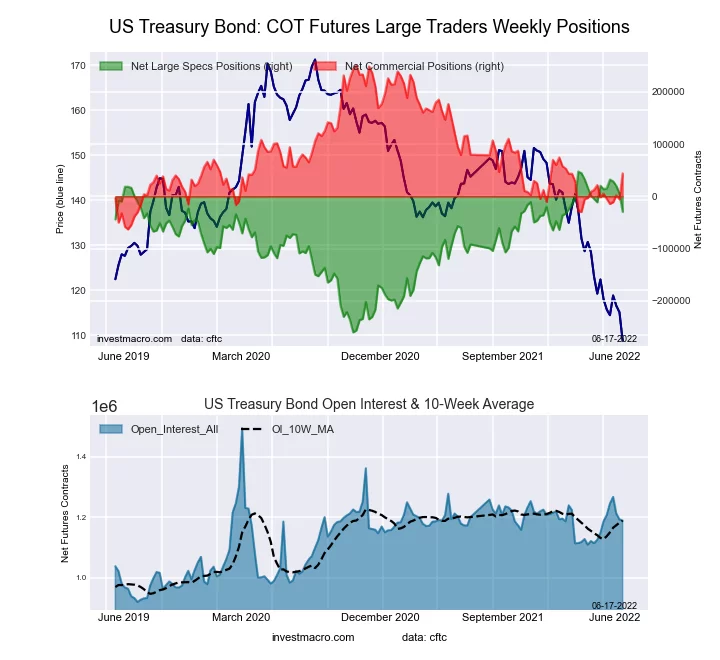
The US Treasury Bonds large speculator standing this week recorded a net position of -29,400 contracts in the data reported through Tuesday. This was a weekly lowering of -34,363 contracts from the previous week which had a total of 4,963 net contracts.
This week’s current strength score (the trader positioning range over the past three years, measured from 0 to 100) shows the speculators are currently Bullish with a score of 75.0 percent. The commercials are Bearish with a score of 32.3 percent and the small traders (not shown in chart) are Bearish with a score of 41.1 percent.
| US Treasury Bonds Statistics | SPECULATORS | COMMERCIALS | SMALL TRADERS |
| – Percent of Open Interest Longs: | 8.7 | 76.8 | 13.1 |
| – Percent of Open Interest Shorts: | 11.1 | 73.1 | 14.3 |
| – Net Position: | -29,400 | 43,870 | -14,470 |
| – Gross Longs: | 102,957 | 912,867 | 155,248 |
| – Gross Shorts: | 132,357 | 868,997 | 169,718 |
| – Long to Short Ratio: | 0.8 to 1 | 1.1 to 1 | 0.9 to 1 |
| NET POSITION TREND: | |||
| – Strength Index Score (3 Year Range Pct): | 75.0 | 32.3 | 41.1 |
| – Strength Index Reading (3 Year Range): | Bullish | Bearish | Bearish |
| NET POSITION MOVEMENT INDEX: | |||
| – 6-Week Change in Strength Index: | -14.0 | 12.7 | 3.3 |
Ultra US Treasury Bonds Futures:
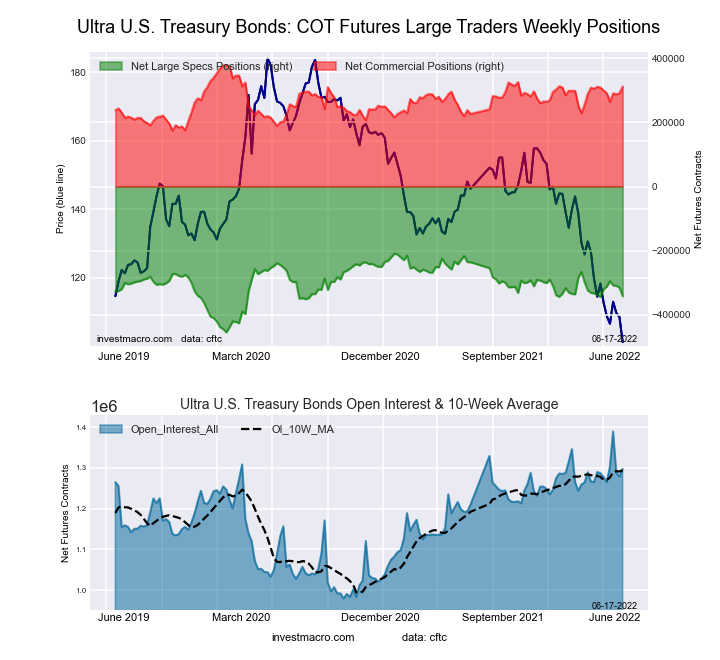
The Ultra US Treasury Bonds large speculator standing this week recorded a net position of -341,601 contracts in the data reported through Tuesday. This was a weekly decrease of -26,628 contracts from the previous week which had a total of -314,973 net contracts.
This week’s current strength score (the trader positioning range over the past three years, measured from 0 to 100) shows the speculators are currently Bearish with a score of 45.9 percent. The commercials are Bullish with a score of 67.4 percent and the small traders (not shown in chart) are Bearish with a score of 50.0 percent.
| Ultra US Treasury Bonds Statistics | SPECULATORS | COMMERCIALS | SMALL TRADERS |
| – Percent of Open Interest Longs: | 3.2 | 84.1 | 11.4 |
| – Percent of Open Interest Shorts: | 29.5 | 60.1 | 9.1 |
| – Net Position: | -341,601 | 311,386 | 30,215 |
| – Gross Longs: | 41,147 | 1,091,594 | 147,658 |
| – Gross Shorts: | 382,748 | 780,208 | 117,443 |
| – Long to Short Ratio: | 0.1 to 1 | 1.4 to 1 | 1.3 to 1 |
| NET POSITION TREND: | |||
| – Strength Index Score (3 Year Range Pct): | 45.9 | 67.4 | 50.0 |
| – Strength Index Reading (3 Year Range): | Bearish | Bullish | Bearish |
| NET POSITION MOVEMENT INDEX: | |||
| – 6-Week Change in Strength Index: | -9.2 | 6.2 | 7.1 |
*COT Report: The COT data, released weekly to the public each Friday, is updated through the most recent Tuesday (data is 3 days old) and shows a quick view of how large speculators or non-commercials (for-profit traders) were positioned in the futures markets.
The CFTC categorizes trader positions according to commercial hedgers (traders who use futures contracts for hedging as part of the business), non-commercials (large traders who speculate to realize trading profits) and nonreportable traders (usually small traders/speculators) as well as their open interest (contracts open in the market at time of reporting).See CFTC criteria here.


Comments
Log in or sign up to join the conversation.