
Here are the latest charts and statistics for the Commitment of Traders (COT) reports data published by the Commodities Futures Trading Commission (CFTC).
The latest COT data is updated through Tuesday November 1st and shows a quick view of how large traders (for-profit speculators and commercial hedgers) were positioned in the futures markets.
Weekly Speculator Changes led lower by Fed Funds, 2-Year & 5-Year
(Click on image to enlarge)
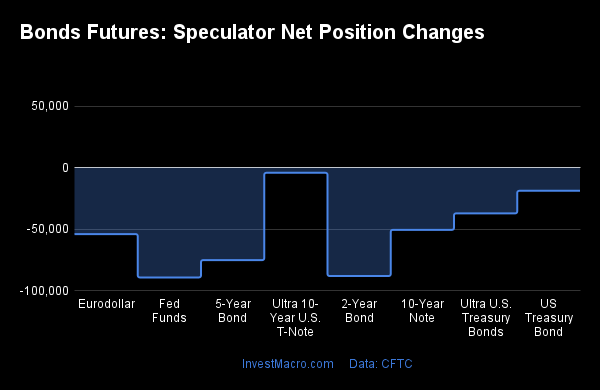
The COT bond market speculator bets were lower across the board this week as all eight of the bond markets we cover had lower positioning this week.
Highlighting the COT bonds data this week is the historic weakness of the 2-Year Bond speculators positioning. Large speculators dropped their bets this week for a second straight week and by the largest weekly amount since May with this week’s decline numbering -88,189 contracts. The sentiment drop has now brought the overall 2-Year Bond speculator standing to its lowest level on record at a total of -437,785 contracts, eclipsing the previous record low of -417,237 contracts registered on December 11th of 2018.
The bond markets overall were on the defensive this week as the US Federal Reserve raised their benchmark interest rate by 75 basis points for the fourth straight meeting. The 2-Year Bond, being near the short end of the yield curve, is especially sensitive to the rate change. The 2-Year front month futures price decreased to the lowest level since 2007 this week while the yield for the 2-Year hit above 5 percent (yields rise as prices fall), the highest threshold since 2007 as well.
|
Nov-01-2022
|
OI
|
OI-Index
|
Spec-Net
|
Spec-Index
|
Com-Net
|
COM-Index
|
Smalls-Net
|
Smalls-Index
|
|---|---|---|---|---|---|---|---|---|
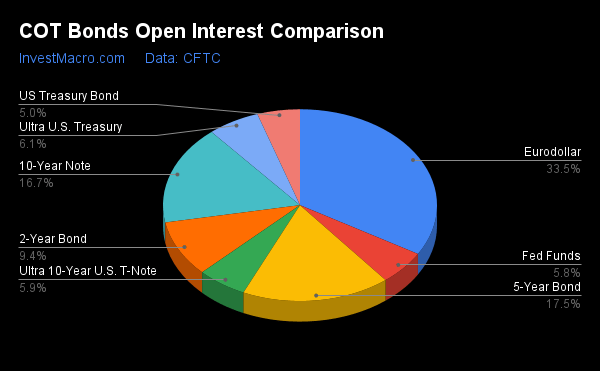
| Eurodollar | 7,921,865 | 0 | -1,950,696 | 17 | 2,217,457 | 81 | -266,761 | 46 |
| 5-Year | 4,140,760 | 59 | -536,987 | 4 | 629,897 | 90 | -92,910 | 56 |
| 10-Year | 3,952,205 | 61 | -298,316 | 27 | 343,554 | 63 | -45,238 | 69 |
| 2-Year | 2,234,148 | 20 | -437,785 | 0 | 464,387 | 100 | -26,602 | 40 |
| FedFunds | 1,364,703 | 32 | -17,005 | 38 | 30,796 | 64 | -13,791 | 25 |
| Long T-Bond | 1,193,687 | 42 | -95,305 | 54 | 64,906 | 34 | 30,399 | 77 |
Strength Scores led by US Treasury Bond
(Click on image to enlarge)
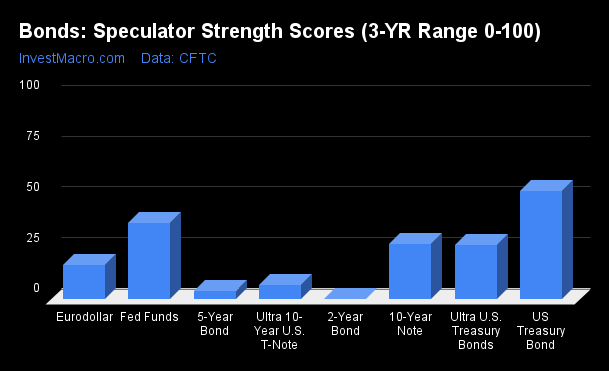
Strength Scores (a normalized measure of Speculator positions over a 3-Year range, from 0 to 100 where above 80 is extreme bullish and below 20 is extreme bearish) show that the US Treasury Bond (53.6 percent) leads the bonds category this week. The Fed Funds (37.5 percent) comes in as the next highest bonds market in strength scores but is down from 48.6 percent from last week.
On the downside, the 2-Year Bond (0.0 percent) comes in at the lowest strength level currently and is followed by the 5-Year Bond (4.3 percent), the Ultra 10-Year Bond (7.1 percent) and the Eurodollar (17.2 percent). All four of these markets currently are in bearish extreme positioning compared to the past three years of speculator positions with scores below 20 percent.
Strength Statistics:
Fed Funds (37.5 percent) vs Fed Funds previous week (48.6 percent)
2-Year Bond (0.0 percent) vs 2-Year Bond previous week (16.8 percent)
5-Year Bond (4.3 percent) vs 5-Year Bond previous week (15.7 percent)
10-Year Bond (27.1 percent) vs 10-Year Bond previous week (34.8 percent)
Ultra 10-Year Bond (7.1 percent) vs Ultra 10-Year Bond previous week (8.2 percent)
US Treasury Bond (53.6 percent) vs US Treasury Bond previous week (59.7 percent)
Ultra US Treasury Bond (26.9 percent) vs Ultra US Treasury Bond previous week (42.0 percent)
Eurodollar (17.2 percent) vs Eurodollar previous week (18.2 percent)
Eurodollar & US Treasury Bond show positive Strength Trends
(Click on image to enlarge)
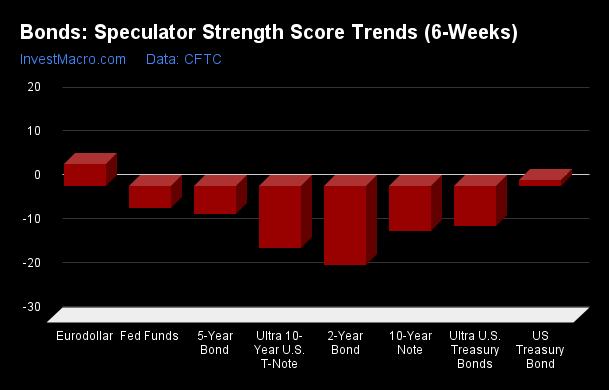
Strength Score Trends (or move index, calculates the 6-week changes in strength scores) show that the Eurodollar (5.0 percent) leads the past six weeks trends for bonds this week. The US Treasury Bond (1.4 percent) is the only other positive mover in the latest trends data.
The 2-Year Bond (-18.1 percent) leads the downside trend scores currently followed by the Ultra 10-Year Bond (-14.2 percent), 10-Year Bond (-10.4 percent), the Ultra US Treasury Bond (-9.1 percent) and the 5-Year Bond (-6.5 percent).
Strength Trend Statistics:
Fed Funds (-5.1 percent) vs Fed Funds previous week (3.0 percent)
2-Year Bond (-18.1 percent) vs 2-Year Bond previous week (1.6 percent)
5-Year Bond (-6.5 percent) vs 5-Year Bond previous week (9.0 percent)
10-Year Bond (-10.4 percent) vs 10-Year Bond previous week (16.0 percent)
Ultra 10-Year Bond (-14.2 percent) vs Ultra 10-Year Bond previous week (-18.9 percent)
US Treasury Bond (1.4 percent) vs US Treasury Bond previous week (6.0 percent)
Ultra US Treasury Bond (-9.1 percent) vs Ultra US Treasury Bond previous week (-1.8 percent)
Eurodollar (5.0 percent) vs Eurodollar previous week (18.1 percent)
Individual Bond Markets:
3-Month Eurodollars Futures:
(Click on image to enlarge)
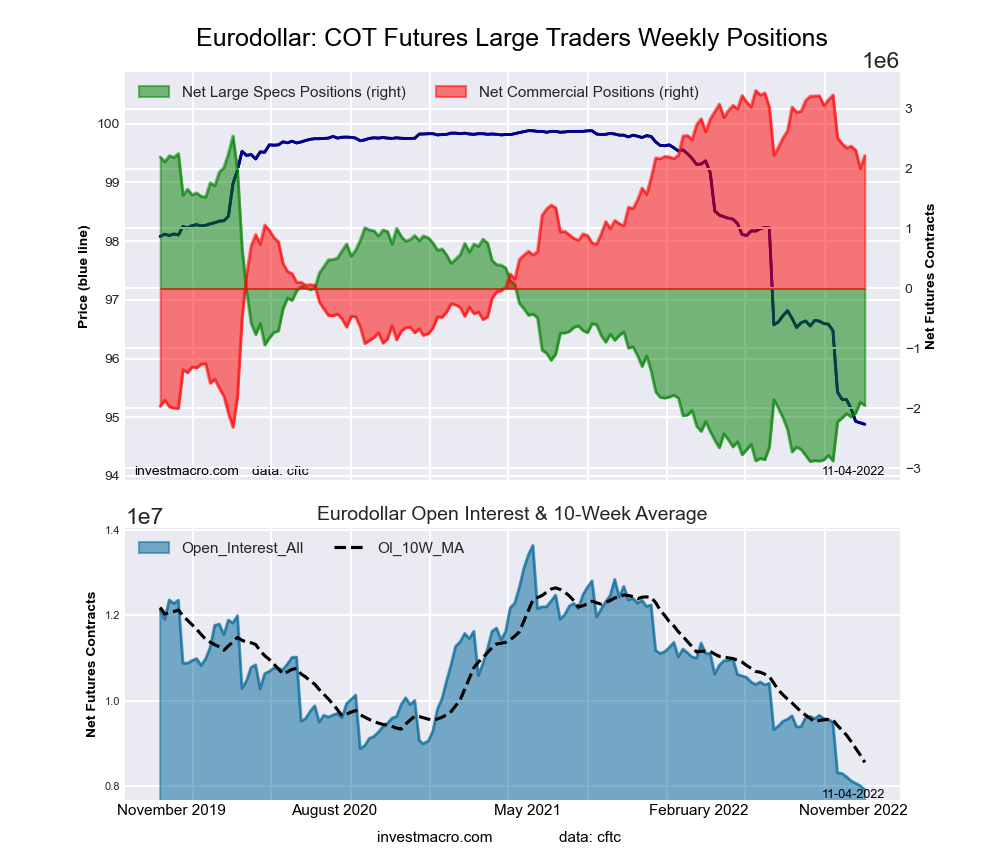
The 3-Month Eurodollars large speculator standing this week reached a net position of -1,950,696 contracts in the data reported through Tuesday. This was a weekly reduction of -54,038 contracts from the previous week which had a total of -1,896,658 net contracts.
This week’s current strength score (the trader positioning range over the past three years, measured from 0 to 100) shows the speculators are currently Bearish-Extreme with a score of 17.2 percent. The commercials are Bullish-Extreme with a score of 80.7 percent and the small traders (not shown in chart) are Bearish with a score of 45.7 percent.
| 3-Month Eurodollars Statistics | SPECULATORS | COMMERCIALS | SMALL TRADERS |
| – Percent of Open Interest Longs: | 7.4 | 67.7 | 4.7 |
| – Percent of Open Interest Shorts: | 32.1 | 39.7 | 8.1 |
| – Net Position: | -1,950,696 | 2,217,457 | -266,761 |
| – Gross Longs: | 589,471 | 5,361,762 | 371,189 |
| – Gross Shorts: | 2,540,167 | 3,144,305 | 637,950 |
| – Long to Short Ratio: | 0.2 to 1 | 1.7 to 1 | 0.6 to 1 |
| NET POSITION TREND: | |||
| – Strength Index Score (3 Year Range Pct): | 17.2 | 80.7 | 45.7 |
| – Strength Index Reading (3 Year Range): | Bearish-Extreme | Bullish-Extreme | Bearish |
| NET POSITION MOVEMENT INDEX: | |||
| – 6-Week Change in Strength Index: | 5.0 | -5.2 | 4.3 |
30-Day Federal Funds Futures:
(Click on image to enlarge)
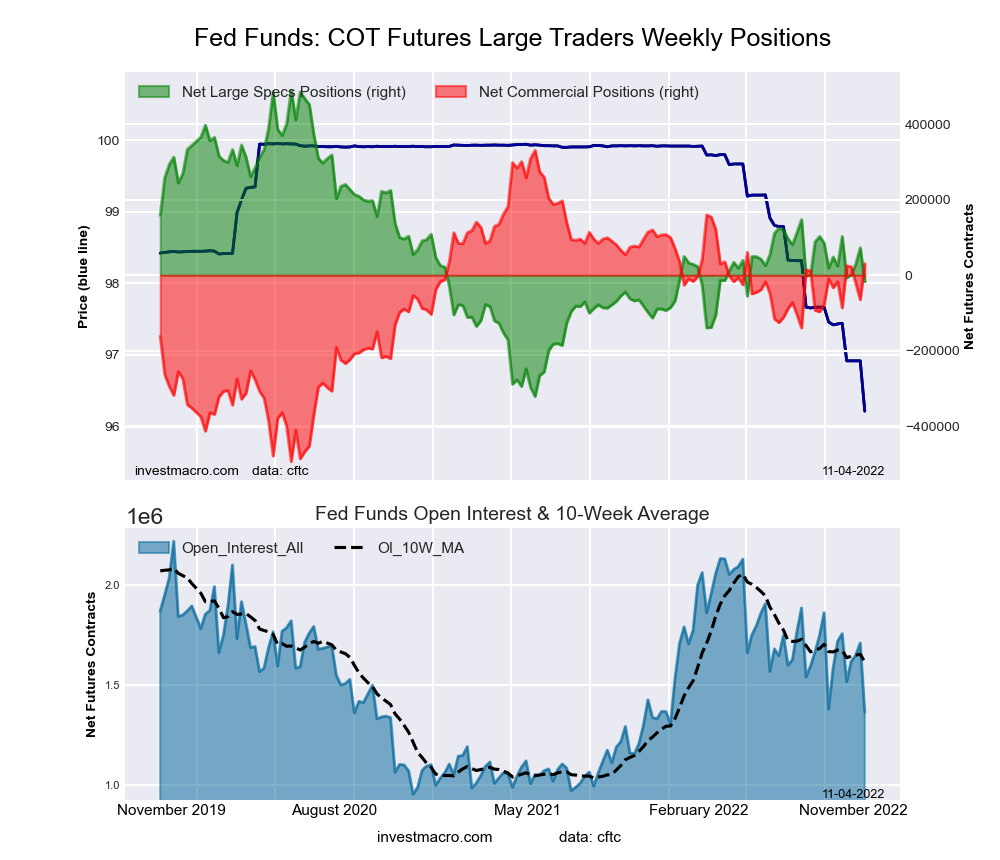
The 30-Day Federal Funds large speculator standing this week reached a net position of -17,005 contracts in the data reported through Tuesday. This was a weekly decline of -89,356 contracts from the previous week which had a total of 72,351 net contracts.
This week’s current strength score (the trader positioning range over the past three years, measured from 0 to 100) shows the speculators are currently Bearish with a score of 37.5 percent. The commercials are Bullish with a score of 63.6 percent and the small traders (not shown in chart) are Bearish with a score of 24.5 percent.
| 30-Day Federal Funds Statistics | SPECULATORS | COMMERCIALS | SMALL TRADERS |
| – Percent of Open Interest Longs: | 10.3 | 73.5 | 1.8 |
| – Percent of Open Interest Shorts: | 11.6 | 71.2 | 2.8 |
| – Net Position: | -17,005 | 30,796 | -13,791 |
| – Gross Longs: | 140,920 | 1,002,689 | 25,091 |
| – Gross Shorts: | 157,925 | 971,893 | 38,882 |
| – Long to Short Ratio: | 0.9 to 1 | 1.0 to 1 | 0.6 to 1 |
| NET POSITION TREND: | |||
| – Strength Index Score (3 Year Range Pct): | 37.5 | 63.6 | 24.5 |
| – Strength Index Reading (3 Year Range): | Bearish | Bullish | Bearish |
| NET POSITION MOVEMENT INDEX: | |||
| – 6-Week Change in Strength Index: | -5.1 | 5.8 | -17.6 |
2-Year Treasury Note Futures:
(Click on image to enlarge)
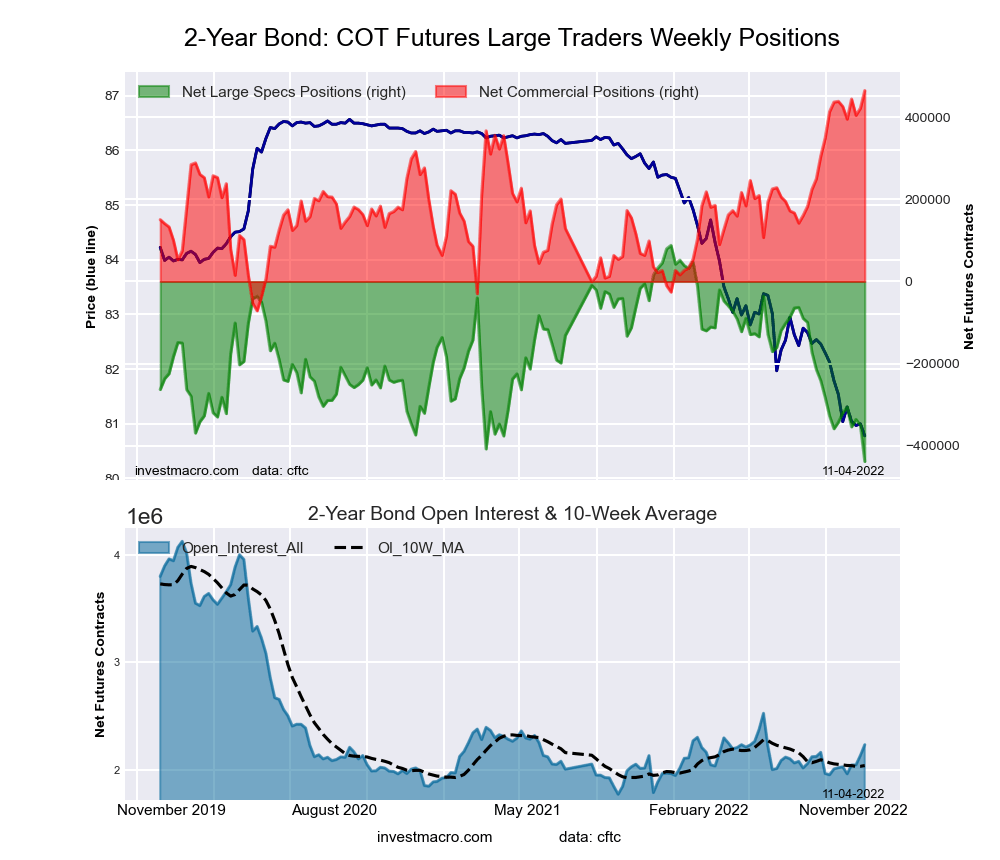
The 2-Year Treasury Note large speculator standing this week reached a net position of -437,785 contracts in the data reported through Tuesday. This was a weekly decline of -88,189 contracts from the previous week which had a total of -349,596 net contracts.
This week’s current strength score (the trader positioning range over the past three years, measured from 0 to 100) shows the speculators are currently Bearish-Extreme with a score of 0.0 percent. The commercials are Bullish-Extreme with a score of 100.0 percent and the small traders (not shown in chart) are Bearish with a score of 40.2 percent.
| 2-Year Treasury Note Statistics | SPECULATORS | COMMERCIALS | SMALL TRADERS |
| – Percent of Open Interest Longs: | 7.4 | 82.0 | 7.6 |
| – Percent of Open Interest Shorts: | 27.0 | 61.2 | 8.8 |
| – Net Position: | -437,785 | 464,387 | -26,602 |
| – Gross Longs: | 164,982 | 1,831,669 | 169,031 |
| – Gross Shorts: | 602,767 | 1,367,282 | 195,633 |
| – Long to Short Ratio: | 0.3 to 1 | 1.3 to 1 | 0.9 to 1 |
| NET POSITION TREND: | |||
| – Strength Index Score (3 Year Range Pct): | 0.0 | 100.0 | 40.2 |
| – Strength Index Reading (3 Year Range): | Bearish-Extreme | Bullish-Extreme | Bearish |
| NET POSITION MOVEMENT INDEX: | |||
| – 6-Week Change in Strength Index: | -18.1 | 4.9 | 30.9 |
5-Year Treasury Note Futures:
(Click on image to enlarge)
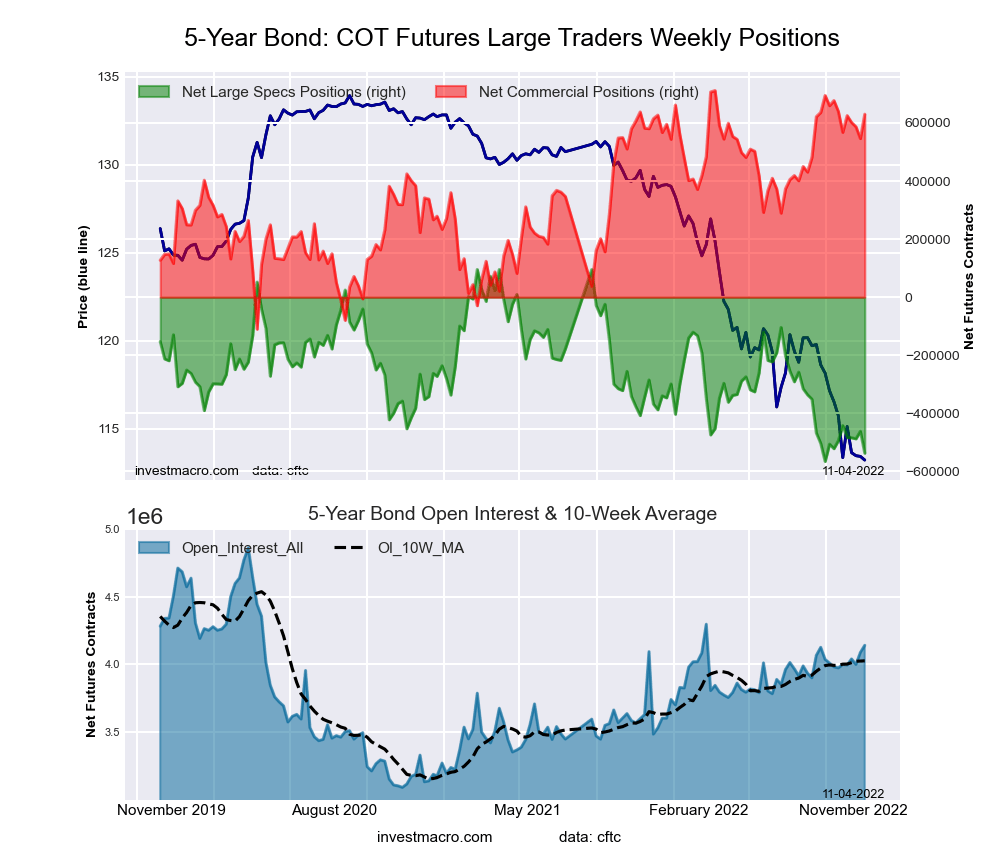
The 5-Year Treasury Note large speculator standing this week reached a net position of -536,987 contracts in the data reported through Tuesday. This was a weekly decrease of -75,242 contracts from the previous week which had a total of -461,745 net contracts.
This week’s current strength score (the trader positioning range over the past three years, measured from 0 to 100) shows the speculators are currently Bearish-Extreme with a score of 4.3 percent. The commercials are Bullish-Extreme with a score of 90.1 percent and the small traders (not shown in chart) are Bullish with a score of 55.5 percent.
| 5-Year Treasury Note Statistics | SPECULATORS | COMMERCIALS | SMALL TRADERS |
| – Percent of Open Interest Longs: | 5.1 | 86.0 | 7.6 |
| – Percent of Open Interest Shorts: | 18.1 | 70.8 | 9.8 |
| – Net Position: | -536,987 | 629,897 | -92,910 |
| – Gross Longs: | 213,179 | 3,559,701 | 313,942 |
| – Gross Shorts: | 750,166 | 2,929,804 | 406,852 |
| – Long to Short Ratio: | 0.3 to 1 | 1.2 to 1 | 0.8 to 1 |
| NET POSITION TREND: | |||
| – Strength Index Score (3 Year Range Pct): | 4.3 | 90.1 | 55.5 |
| – Strength Index Reading (3 Year Range): | Bearish-Extreme | Bullish-Extreme | Bullish |
| NET POSITION MOVEMENT INDEX: | |||
| – 6-Week Change in Strength Index: | -6.5 | -1.2 | 14.5 |
10-Year Treasury Note Futures:
(Click on image to enlarge)
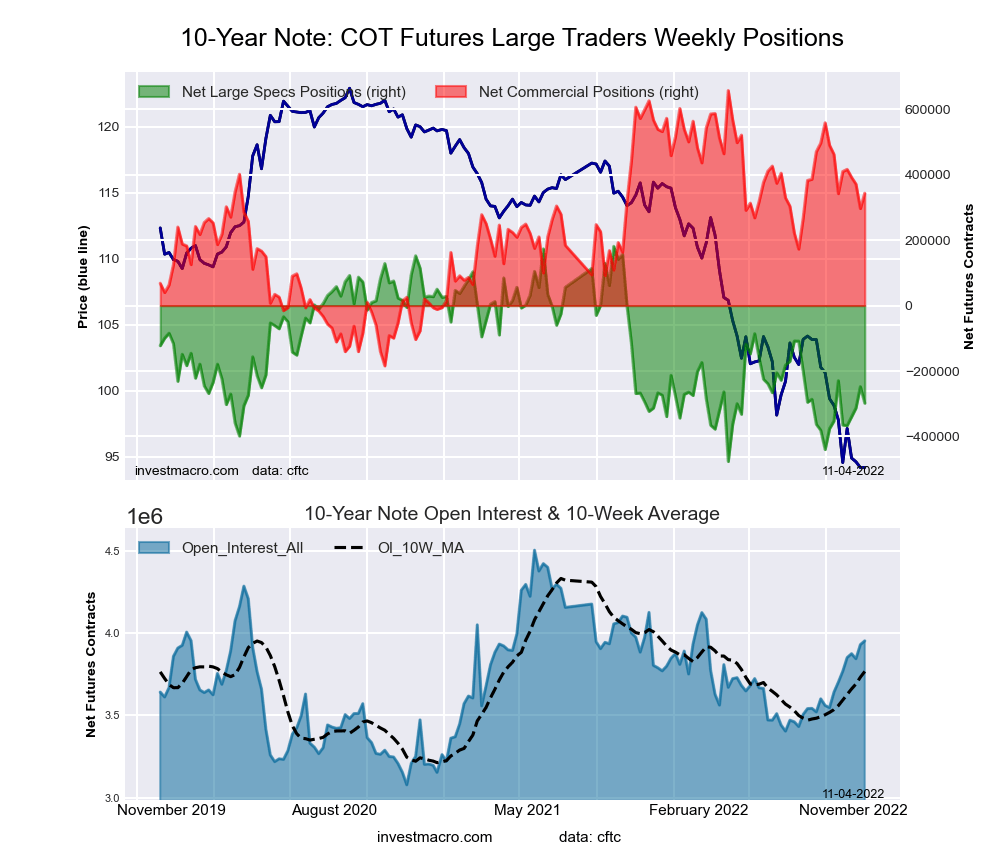
The 10-Year Treasury Note large speculator standing this week reached a net position of -298,316 contracts in the data reported through Tuesday. This was a weekly fall of -50,568 contracts from the previous week which had a total of -247,748 net contracts.
This week’s current strength score (the trader positioning range over the past three years, measured from 0 to 100) shows the speculators are currently Bearish with a score of 27.1 percent. The commercials are Bullish with a score of 62.7 percent and the small traders (not shown in chart) are Bullish with a score of 69.3 percent.
| 10-Year Treasury Note Statistics | SPECULATORS | COMMERCIALS | SMALL TRADERS |
| – Percent of Open Interest Longs: | 11.9 | 76.5 | 9.1 |
| – Percent of Open Interest Shorts: | 19.5 | 67.8 | 10.2 |
| – Net Position: | -298,316 | 343,554 | -45,238 |
| – Gross Longs: | 471,166 | 3,021,952 | 357,967 |
| – Gross Shorts: | 769,482 | 2,678,398 | 403,205 |
| – Long to Short Ratio: | 0.6 to 1 | 1.1 to 1 | 0.9 to 1 |
| NET POSITION TREND: | |||
| – Strength Index Score (3 Year Range Pct): | 27.1 | 62.7 | 69.3 |
| – Strength Index Reading (3 Year Range): | Bearish | Bullish | Bullish |
| NET POSITION MOVEMENT INDEX: | |||
| – 6-Week Change in Strength Index: | -10.4 | 0.1 | 16.0 |
Ultra 10-Year Notes Futures:
(Click on image to enlarge)
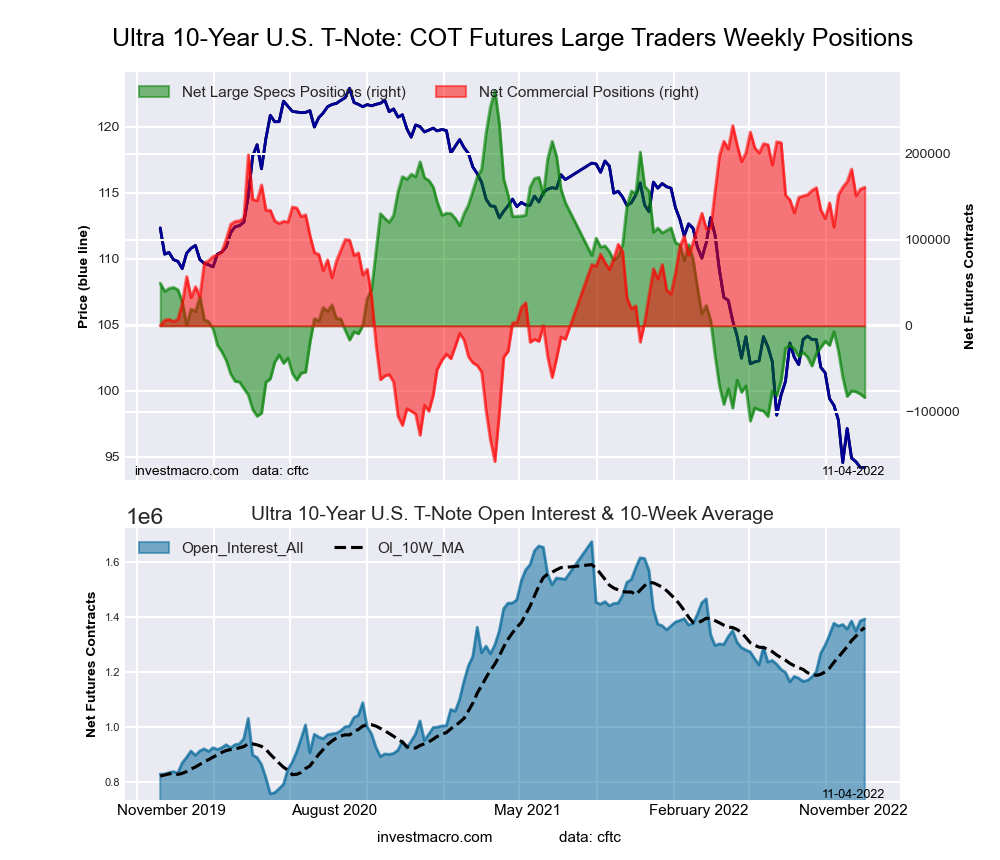
The Ultra 10-Year Notes large speculator standing this week reached a net position of -83,431 contracts in the data reported through Tuesday. This was a weekly decline of -4,085 contracts from the previous week which had a total of -79,346 net contracts.
This week’s current strength score (the trader positioning range over the past three years, measured from 0 to 100) shows the speculators are currently Bearish-Extreme with a score of 7.1 percent. The commercials are Bullish-Extreme with a score of 81.6 percent and the small traders (not shown in chart) are Bullish with a score of 75.4 percent.
| Ultra 10-Year Notes Statistics | SPECULATORS | COMMERCIALS | SMALL TRADERS |
| – Percent of Open Interest Longs: | 7.9 | 80.4 | 11.0 |
| – Percent of Open Interest Shorts: | 13.9 | 68.8 | 16.6 |
| – Net Position: | -83,431 | 161,124 | -77,693 |
| – Gross Longs: | 109,513 | 1,118,917 | 153,574 |
| – Gross Shorts: | 192,944 | 957,793 | 231,267 |
| – Long to Short Ratio: | 0.6 to 1 | 1.2 to 1 | 0.7 to 1 |
| NET POSITION TREND: | |||
| – Strength Index Score (3 Year Range Pct): | 7.1 | 81.6 | 75.4 |
| – Strength Index Reading (3 Year Range): | Bearish-Extreme | Bullish-Extreme | Bullish |
| NET POSITION MOVEMENT INDEX: | |||
| – 6-Week Change in Strength Index: | -14.2 | 2.3 | 30.2 |
US Treasury Bonds Futures:
(Click on image to enlarge)
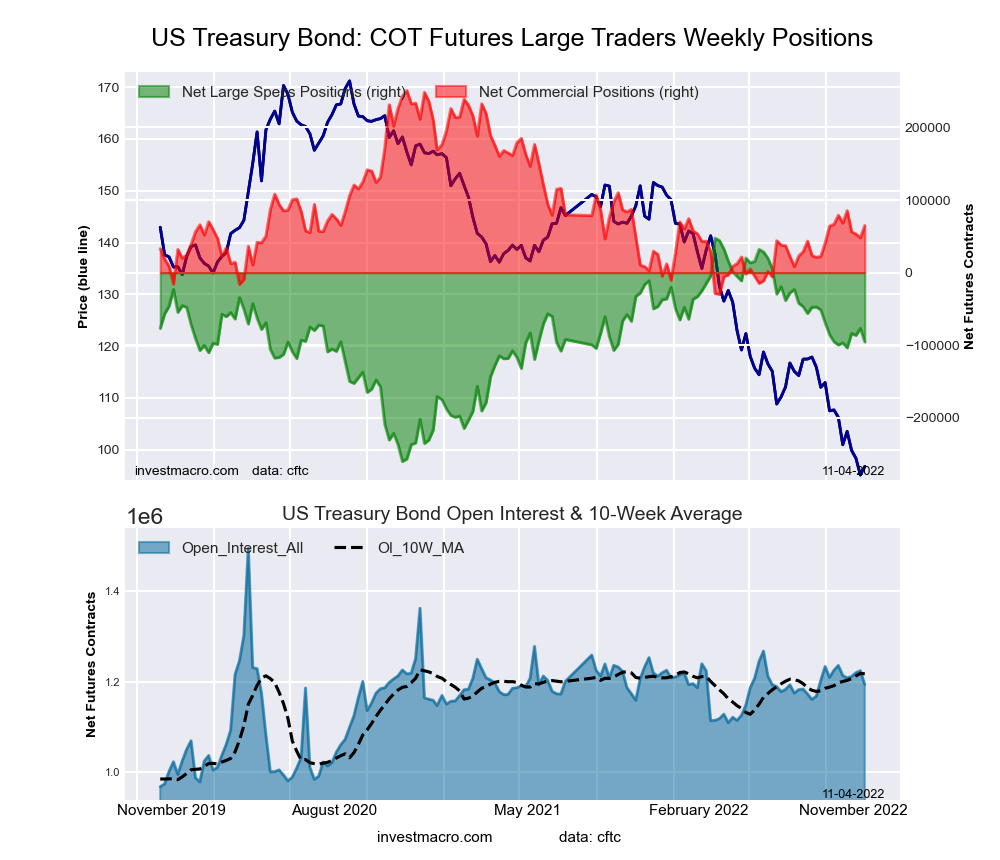
The US Treasury Bonds large speculator standing this week reached a net position of -95,305 contracts in the data reported through Tuesday. This was a weekly lowering of -18,746 contracts from the previous week which had a total of -76,559 net contracts.
This week’s current strength score (the trader positioning range over the past three years, measured from 0 to 100) shows the speculators are currently Bullish with a score of 53.6 percent. The commercials are Bearish with a score of 33.8 percent and the small traders (not shown in chart) are Bullish with a score of 76.7 percent.
| US Treasury Bonds Statistics | SPECULATORS | COMMERCIALS | SMALL TRADERS |
| – Percent of Open Interest Longs: | 5.6 | 79.2 | 14.3 |
| – Percent of Open Interest Shorts: | 13.6 | 73.7 | 11.7 |
| – Net Position: | -95,305 | 64,906 | 30,399 |
| – Gross Longs: | 67,408 | 945,230 | 170,536 |
| – Gross Shorts: | 162,713 | 880,324 | 140,137 |
| – Long to Short Ratio: | 0.4 to 1 | 1.1 to 1 | 1.2 to 1 |
| NET POSITION TREND: | |||
| – Strength Index Score (3 Year Range Pct): | 53.6 | 33.8 | 76.7 |
| – Strength Index Reading (3 Year Range): | Bullish | Bearish | Bullish |
| NET POSITION MOVEMENT INDEX: | |||
| – 6-Week Change in Strength Index: | 1.4 | -5.0 | 7.8 |
Ultra US Treasury Bonds Futures:
(Click on image to enlarge)
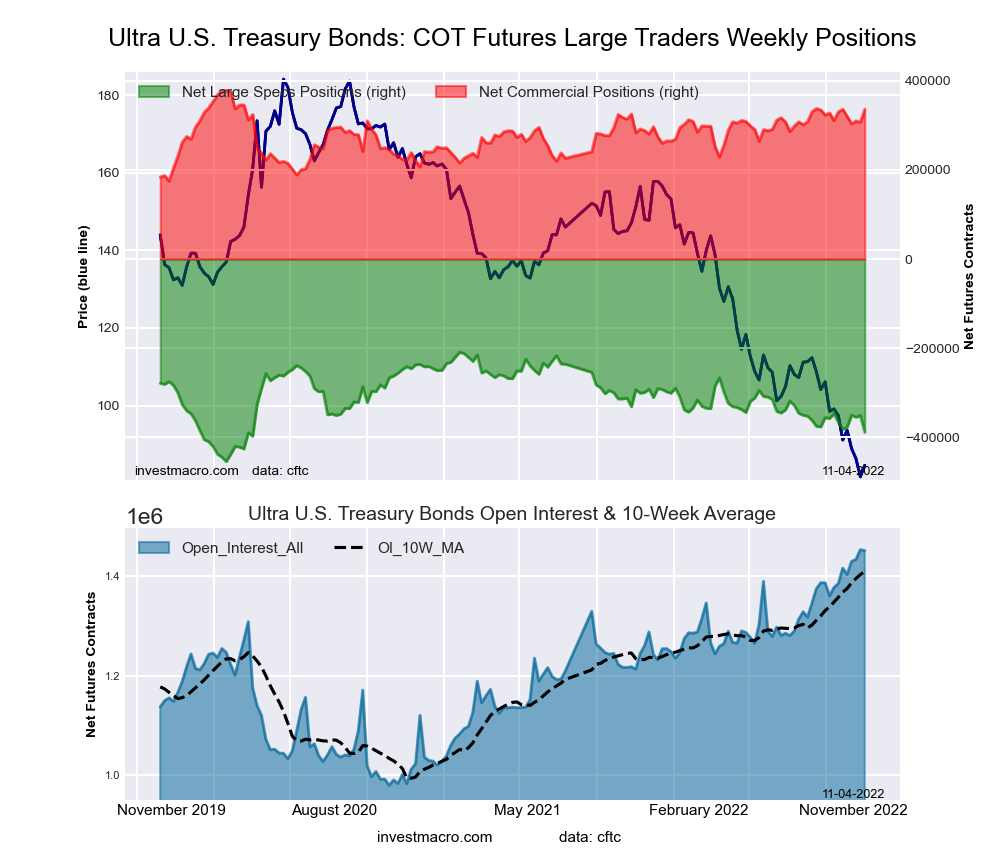
The Ultra US Treasury Bonds large speculator standing this week reached a net position of -388,166 contracts in the data reported through Tuesday. This was a weekly lowering of -37,144 contracts from the previous week which had a total of -351,022 net contracts.
This week’s current strength score (the trader positioning range over the past three years, measured from 0 to 100) shows the speculators are currently Bearish with a score of 26.9 percent. The commercials are Bullish with a score of 77.8 percent and the small traders (not shown in chart) are Bullish with a score of 74.7 percent.
| Ultra US Treasury Bonds Statistics | SPECULATORS | COMMERCIALS | SMALL TRADERS |
| – Percent of Open Interest Longs: | 5.9 | 82.6 | 11.4 |
| – Percent of Open Interest Shorts: | 32.7 | 59.4 | 7.8 |
| – Net Position: | -388,166 | 335,892 | 52,274 |
| – Gross Longs: | 85,681 | 1,198,023 | 165,861 |
| – Gross Shorts: | 473,847 | 862,131 | 113,587 |
| – Long to Short Ratio: | 0.2 to 1 | 1.4 to 1 | 1.5 to 1 |
| NET POSITION TREND: | |||
| – Strength Index Score (3 Year Range Pct): | 26.9 | 77.8 | 74.7 |
| – Strength Index Reading (3 Year Range): | Bearish | Bullish | Bullish |
| NET POSITION MOVEMENT INDEX: | |||
| – 6-Week Change in Strength Index: | -9.1 | 3.0 | 13.5 |
Article By InvestMacro – Receive our weekly COT Newsletter
*COT Report: The COT data, released weekly to the public each Friday, is updated through the most recent Tuesday (data is 3 days old) and shows a quick view of how large speculators or non-commercials (for-profit traders) were positioned in the futures markets.
The CFTC categorizes trader positions according to commercial hedgers (traders who use futures contracts for hedging as part of the business), non-commercials (large traders who speculate to realize trading profits) and nonreportable traders (usually small traders/speculators) as well as their open interest (contracts open in the market at time of reporting). See CFTC criteria here.
More By This Author:
COT Metals Speculators Drop Silver Bets Into Small Bearish Position
Coffee Speculators Drop Their Bullish Bets For 4th Week To 118-Week Low
COT Forex Speculators Boost Euro Bullish Bets To 68-Week High


Comments
Log in or sign up to join the conversation.