
CNH Vs CNY: Differences Between The Two Yuan
WHAT IS CNH AND CNY AND WHAT ARE THE MAIN DIFFERENCES?
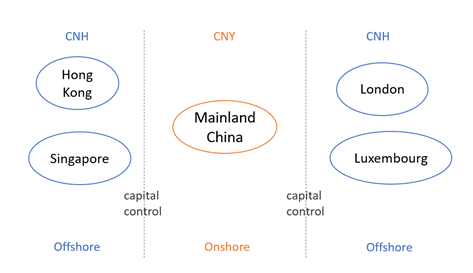
CNH refers to the Chinese Yuan in the offshore market, which is outside of Mainland China (the onshore market). China’s capital markets, including the FX market, are controlled and not fully opened yet. This leads to different features of the Chinese currency in the onshore and offshore markets, and thus two tickers are assigned to distinguish them.
In the onshore Mainland China market, the Chinese Yuan is called CNY. On the other hand, the offshore market includes traditional Yuan centers, such as Hong Kong (a special administrative region of China), Singapore, London and newly-developed centers such as Luxembourg.
(Click on image to enlarge)
THE HISTORY OF CNY
USD/CNY Price Chart from 1992 to 2018
(Click on image to enlarge)
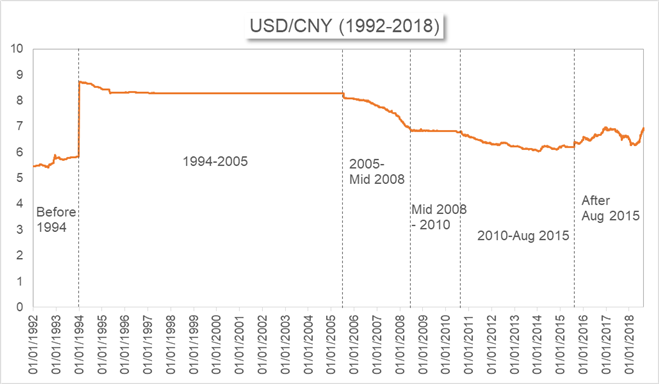
Data downloaded from Bloomberg; chart prepared by Renee Mu.
1994- 2005: A sole CNY rate was formed, signaling the start of China’s modern foreign exchange rate system. Before 1994, China had two CNY rates in the onshore market, an official rate, and a market rate. The spread was significant. For example, at the end of 1993, the official USD/CNY rate was 5.8 while the market rate was 8.7. On January 1, 1994, the dual-track exchange rate system was ended, with the two CNY exchange rates merged into one.
2005 - Mid 2008: The CNY flexibility was increased. On July 2, 2005, the USD/CNY was strengthened by +2.1% from 8.2765 to 8.1100, following China’s Central Bank launching a managed-floating exchange rate regime. Under the new system, the Central Bank loosened Yuan’s pegging against a sole currency – USD and introduced a basket of currencies as the new reference.
Mid 2008 - 2010: The CNY was re-pegged to the USD, following the eruption of the global financial crisis in the mid of 2008. This was used as a measure to protect China’s international trade during the crisis. The USD/CNY was restricted in a narrow range between 6.81 and 6.85.
2010 - Aug 2018: The CNY reform was resumed. The flexibility in the Yuan was increased again after the financial crisis. On April 16, 2012, the CNY daily trading band was raised from 0.5% to 1%. Then, it further expanded to 2% on March 17, 2014.
Aug 2018 - Today: The CNY was de-pegged against the USD and referred to a basket of currencies again. On August 11, 2015, China’s Central Bank weakened the daily CNY fixing (Yuan’s reference rate) by -1.82% to 6.2298, starting a new round of reforms on the Chinese currency. On December 11, 2015, the PBOC introduced CFETS Yuan Index, a reference for the CNY price.
As of today, China has continued to adopt the managed-floating exchange rate regime in the onshore market. The USD/CNY remains to be the top pair among all Yuan pairs and has the highest trading volume; at the same time, China’s Central Bank also looks to other CNY pairs when guiding the onshore Yuan rate.
THE HISTORY OF CNH
USD/CNH Price Chart from August 2010 to August 2018
(Click on image to enlarge)

Data downloaded from Bloomberg; chart prepared by Renee Mu.
2004 - 2010: Preparation Phase for CNH. The CNH has a much shorter history than the CNY. The letter “H” in CNH was originally referred to Hong Kong, the first offshore market for the Yuan. In 2004, Hong Kong began to introduce Chinese Yuan business, such as trade settlements in the Yuan.
2010 - Today: CNH was launched and in use. On July 2010, China’s Central Bank (PBOC) and Hong Kong Monetary Authority signed the revised clearing agreement on the Chinese Yuan, marking a milestone for the offshore Yuan development. On August 23, a quote on the USD/CNH was launched, signaling the start of the Chinese Yuan trading in the offshore market.
WHAT IS THE DIFFERENCE BETWEEN CNY AND CNH IN TRADING?
It is important for traders to understand the difference between CNY and CNH. Fundamentally, the CNH, traded in the offshore market, is considered to be less controlled and more market-driven than the CNY. This makes it more like a free-floating currency than the CNY and a better choice for speculative trading.
USD/CNH vs USD/CNY Price Chart from August 2015 to August 2018
(Click on image to enlarge)
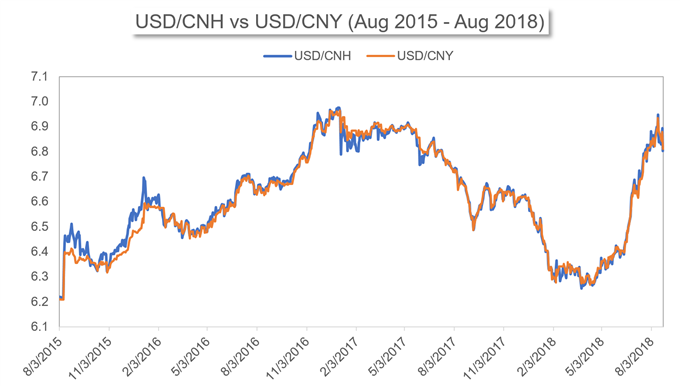
Greater volatility is more likely to be seen in the CNH than the CNY when they respond to the same event. For instance, from May 2018 to August 2018, both the USD/CNH and the USD/CNY rose from a 15-month low to high, largely driven by the US-China trade war. The USD/CNH advanced from 6.2358 to 6.9587 while the USD/CNY increased from 6.2419 to 6.9347.
CNH/CNY SPREAD & CHINA’S FOREIGN EXCHANGE RATE POLICY
The CNH is normally slightly weaker than the CNY based on the historical record. A widened spread is often correlated with Yuan’s weakness, especially when a fast-falling Yuan price is seen.
CNH/CNY Spread: One Week
(Click on image to enlarge)

This is because China’s foreign exchange policy is to gradually increase Yuan’s flexibility while keeping the Yuan relatively stable and at reasonable levels. When massive Yuan shorts are seen, the PBOC tends to calm down the market through measures such as the daily reference rate. These measures normally will first work on the onshore Yuan (CNY) and then take some time to impact the offshore Yuan (CNH). As a result, an elevated spread could emerge.
Disclosure: Do you want to see how retail traders are currently trading the US Dollar? Check out our IG Client Sentiment ...
more

