
Canadian Dollar Price Outlook: USD/CAD Coils After Loonie Breakdown
CANADIAN DOLLAR, CAD, USD/CAD, LOONIE PRICE ANALYSIS
- After a strong showing of volatility over the past month, USD/CAD put in a week of digestion.
- USD/CAD came close to taking out the 17-year-high just a few weeks ago, but this was followed by an aggressive pullback down below the 1.4000 handle.
- This week saw buyers cauterize support above the major psychological level, and given the coil and digestion in USD/CAD, breakout potential remains as the first full week of April approaches.
USD/CAD COILS AFTER MAJOR BREAKOUT IN MARCH
The month of March was a big one for USD/CAD, and there were a number of as an extreme dose of risk aversion pushed a flight-to-quality in the US Dollar; and numerous actions taken at the Bank of Canada helped to continue the theme of Loonie weakness that’s been so present through 2020 trade so far.
While the US Dollar had gained as much as 8.8% last month, USD/CAD had moved up by as much as 10.2%; highlighting that additional CAD weakness that helped to push USD/CAD up to a fresh four-year-high. The pair came very close to taking out the 17-year-high, falling around 21 pips short of re-testing that level before starting to pullback in the final full week of March trade, eventually finding support around the 1.3929 area on the chart.
This week’s outlay in USD/CAD was marked by a gap above the psychological level at 1.4000, and buyers held support above the big figure through this week’s trade. And as the week went on, the range grew tighter and tighter, keeping the door open for breakout scenarios in the days and weeks ahead.
USD/CAD FOUR-HOUR PRICE CHART
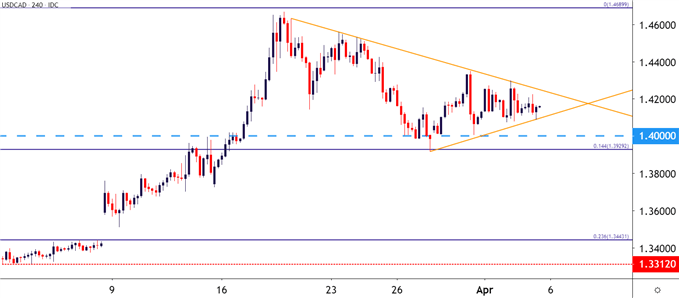
Chart prepared by James Stanley; USDCAD on Tradingview
A Fibonacci retracement drawn on the pullback in the late-March has helped to govern the recent digestion in USD/CAD. The 23.6% retracement of that move has held support through a couple of different tests in early-April trade, while both the 50% and 38.2% markers have functioned as resistance. breakout scenarios.
| CHANGE IN | LONGS | SHORTS | OI |
| DAILY | -4% | 7% | 3% |
| WEEKLY | 12% | 0% | 4% |
Current Retail Sentiment in USD/CAD
This is something that could feed from a short-term observation into longer-term strategy, as bulls can look for tests or holds of support around the 1.4095 level to open the door for bullish scenarios while bears can look to resistance tests around the 1.4200 handle to open the door for short-side setups.
USD/CAD TWO-HOUR PRICE CHART
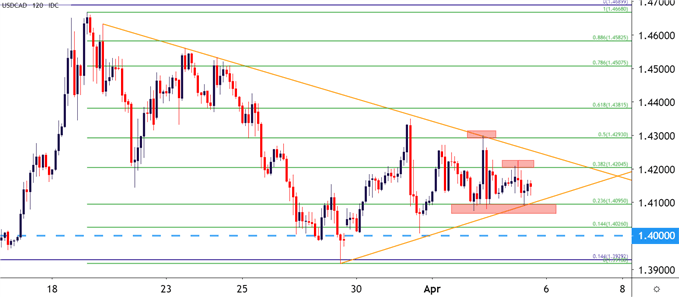
Chart prepared by James Stanley; USDCAD on Tradingview


