
Canadian Dollar Price Forecast: USD/CAD Showing Reversal Tendencies
USD/CAD JUMPS TO START 2020 AND THEN GIVES IT BACK
It’s been a wild 2020 so far in USD/CAD but, as of a few weeks ago, the net movement in the pair was close to a ‘null.’ The 1.3000 psychological level is of particular importance in the pair and this theme stretches back to last year. While USD/CAD spent the bulk of the year in a range displaying tendencies of mean reversion, the 1.3000 level largely remained unfettered until the final trading day of 2019 when bears were finally able to push-below. And that sub 1.3000 environment lasted into the first week of 2020, but buyers soon showed up with gusto to drive the pair aggressively-higher.
That strength theme hit fever pitch as the coronavirus was getting priced-in. A potent combo of USD-strength going along with weak oil prices driving a weak Canadian Dollar helped USD/CAD jump up to a fresh high, coming a mere 21 pips from taking out the 17-year high.
In the six months since that failed run at the 17-year-high, USD/CAD has given back the bulk of that bullish move. The 1.3000 level came back into play on the first trading day of September, and since then buyers have started to show a more concerted push, opening the door to the prospect of reversal as the Q4 open nears.
USD/CAD DAILY PRICE CHART
(Click on image to enlarge)
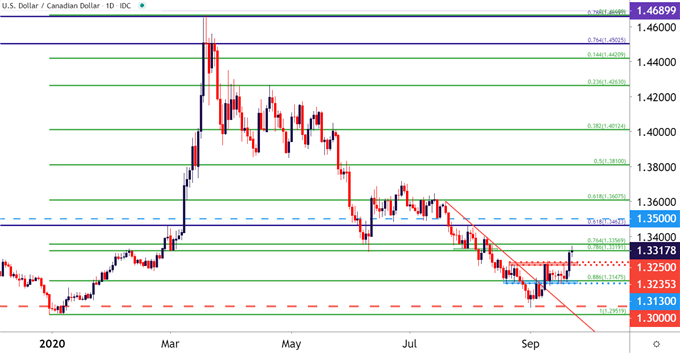
Chart prepared by James Stanley; USDCAD on Tradingview
USD/CAD: SEPTEMBER BRINGS A DIFFERENT TONE
The September open has so far ushered in a few different themes of interest, hinting at the possibility of change on the horizon. This is relevant to both global equities as well as the US Dollar and, in-turn, USD/CAD.
While the pair spent the bulk of July and August in a down-trend, similar to the post-March backdrop in USD/CAD, the big question is whether that 1.3000 spot on USD/CAD may have finally arrested the declines as the final quarter of the year gets closer.
Going down to the four-hour chart highlights a continued series of higher-highs and higher-lows coming into play since that Sept. 1 low. I had looked at support structure in the pair a couple of weeks ago just after the Bank of Canada rate decision; and that structure largely remains in-tact with prior resistance now showing as near-term potential support. Current resistance appears to be coming in from the 78.6% retracement of the 2020 major move in USD/CAD.
USD/CAD FOUR-HOUR PRICE CHART
(Click on image to enlarge)
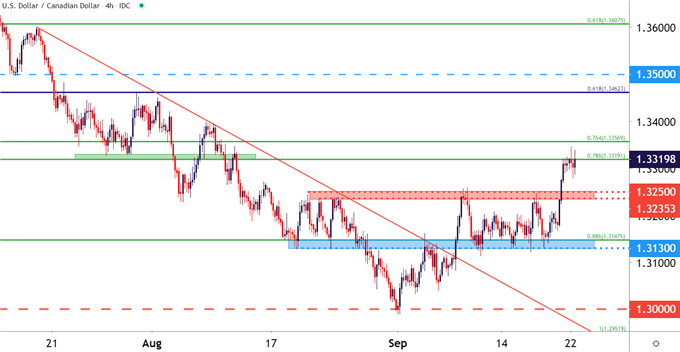
Chart prepared by James Stanley; USDCAD on Tradingview
USD/CAD MOVING FORWARD
At this point, USD/CAD brings bullish continuation potential, and likely, this will be inextricably linked to the larger theme of USD strength.
The concern at this point would be chasing a market that’s just broken out to fresh near-term highs and finding resistance. A pullback to support around prior resistance, plotted at the approximate 1.3235-1.3250 area could quickly open the door to bullish continuation themes; and for follow-through resistance, such potential exists in the zone running from 1.3462-1.3500.
USD/CAD FOUR-HOUR PRICE CHART
(Click on image to enlarge)
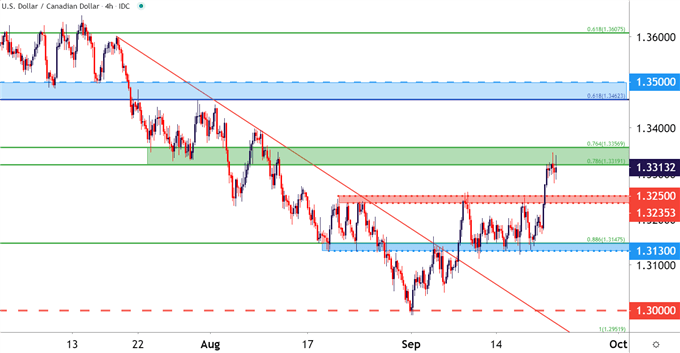
Chart prepared by James Stanley; USDCAD on Tradingview
Disclosure: See the full disclosure for DailyFX here.


