

Canadian Dollar weakness has been a building theme over the past month. The US Dollar finished November as its worst month in more than a decade, but since USD/CAD found support at the 1.3250 psychological level in the middle of last month, the Canadian Dollar has actually been weaker than its US counterpart. The pair has now gained as much as 450 pips from that support test up to this morning’s high, just inside of the 1.3700 handle.
This sets up USD/CAD as perhaps one of the more attractive pairs for working with themes of USD strength, if that theme does come back into the end of the year. Or, as I looked at last month, there’s also the option of focusing that expectation of CAD-weakness elsewhere, such as CAD/JPY or perhaps even EUR/CAD.
From the daily chart of USD/CAD, we can see this morning’s high coming in around the 1.3700 level. Near-term support shows around yesterday’s low, plotted at a area of prior resistance at 1.3578. If bulls remain very aggressive, which would likely have some overlay with USD-strength themes if it happens, that level could become workable. Below that the 1.3500 psychological level remains as support potential; and there hasn’t been a support test there since price broke out from this level on a really strong Monday showing.
As for resistance – price is right now finding sellers at a key Fibonacci level, as the 61.8% retracement of the 2020-2021 major move rests at 1.3652.
USD/CAD Daily Price Chart
(Click on image to enlarge)
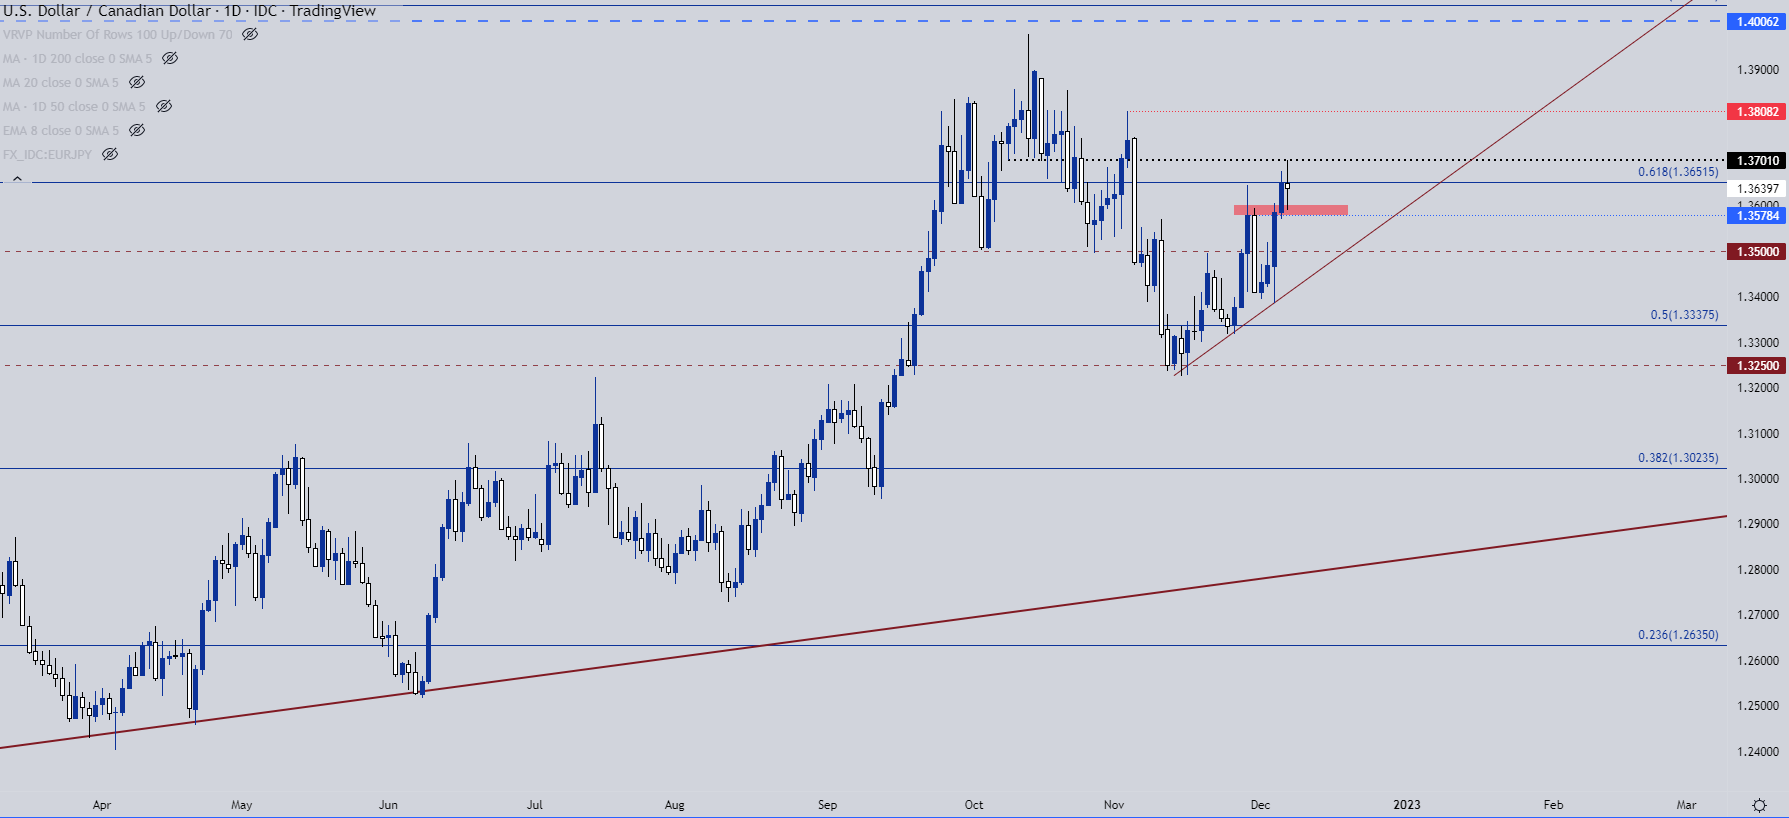
Chart prepared by James Stanley; USDCAD on Tradingview
Taking a step back to the weekly chart and we can see the re-emergence of CAD weakness in a very visible way since that 1.3250 support test. This week is already working on a large move and just above the 1.3700 resistance is a swing high at 1.3800 that remains of interest.
And longer-term, it’s the 1.4000 psychological level that looms large. The topside run into October came 20 pips away from the big figure before turning around.
USD/CAD Weekly Chart
(Click on image to enlarge)
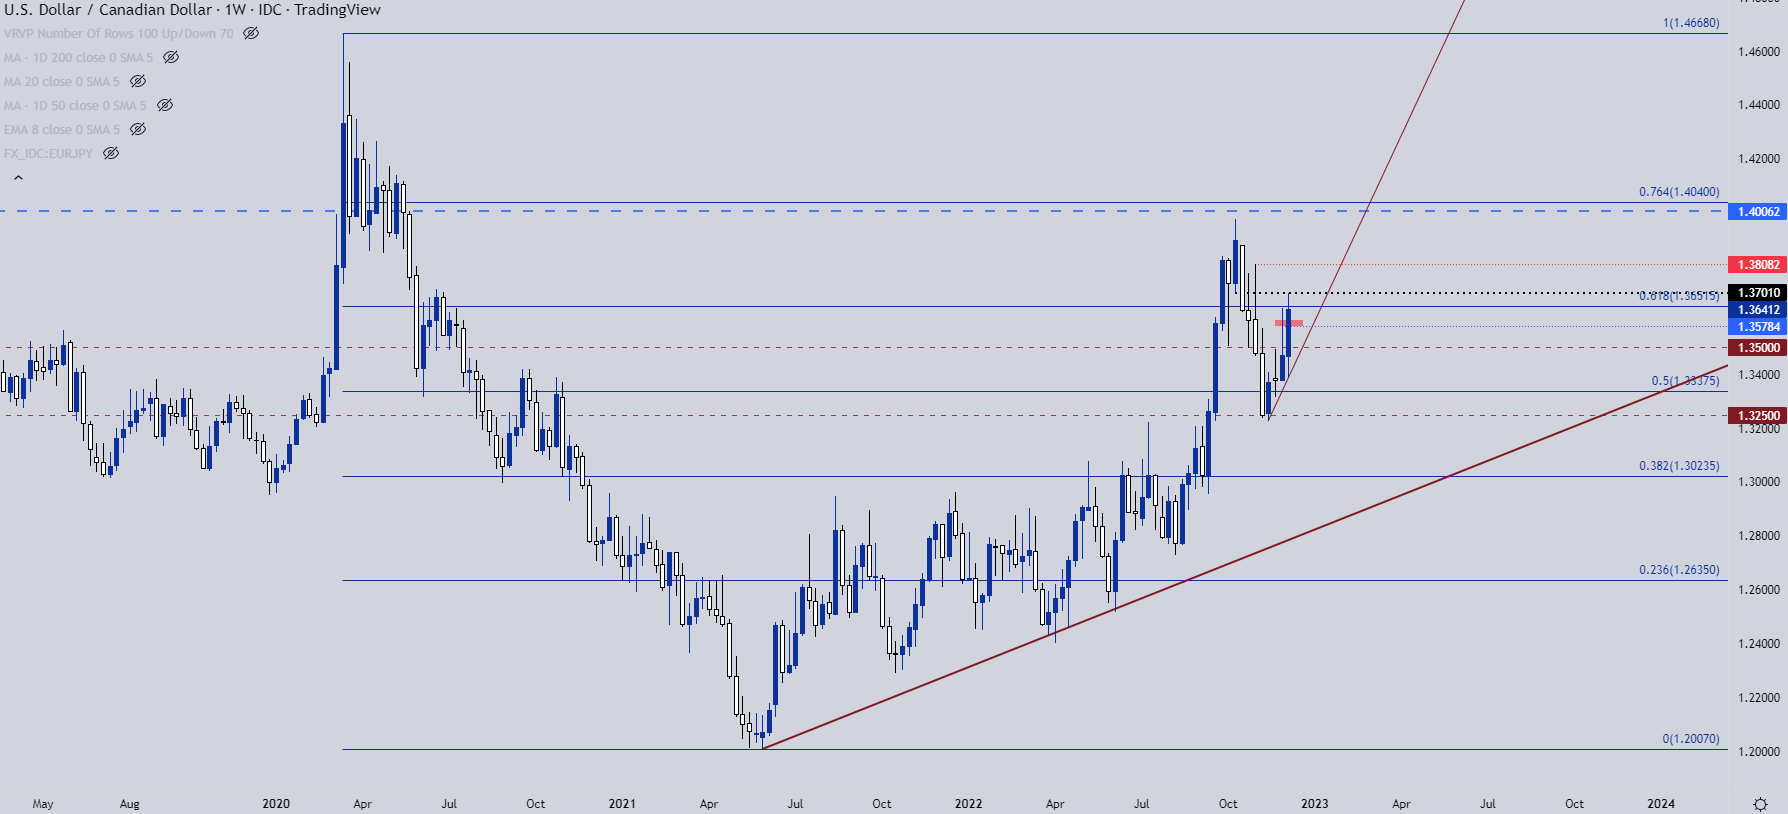
Chart prepared by James Stanley; USDCAD on Tradingview
CAD/JPY
When I had looked into the Canadian Dollar a month ago, I highlighted the potential to focus CAD-weakness scenarios away from the US Dollar, namely due to uncertainty around the USD as prices in DXY were continuing to pullback.
Ideally, currency weakness in CAD could be better meshed with currency strength elsewhere, and the Japanese Yen has been considerably stronger since that article was published.
CAD/JPY has developed an aggressive bearish move, breaking below a symmetrical triangle and then breaching a bullish trendline. At this point, psychological support is playing in off of the 100-handle. This could be a difficult spot to chase the move given how extended the sell-off has been. There was a prior spot of support around the 102.30 level and this now becomes resistance potential if a bounce can develop. For those looking to move forward with breakout logic, the currency five-month-low is at 99.49.
CAD/JPY Daily Chart
(Click on image to enlarge)
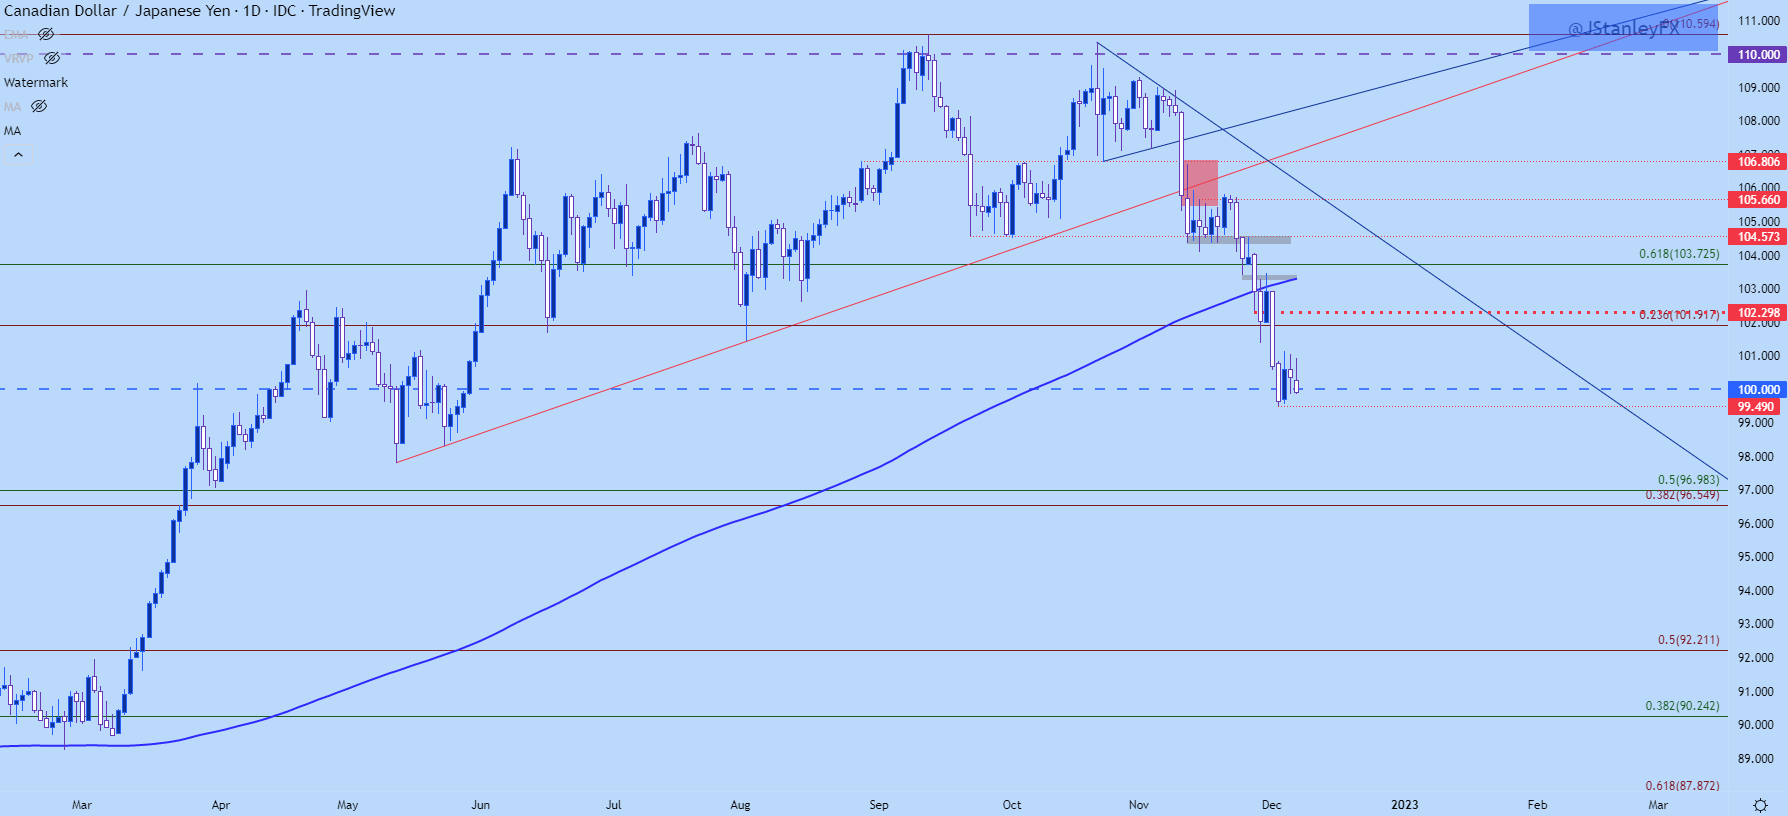
Chart prepared by James Stanley; CADJPY on Tradingview
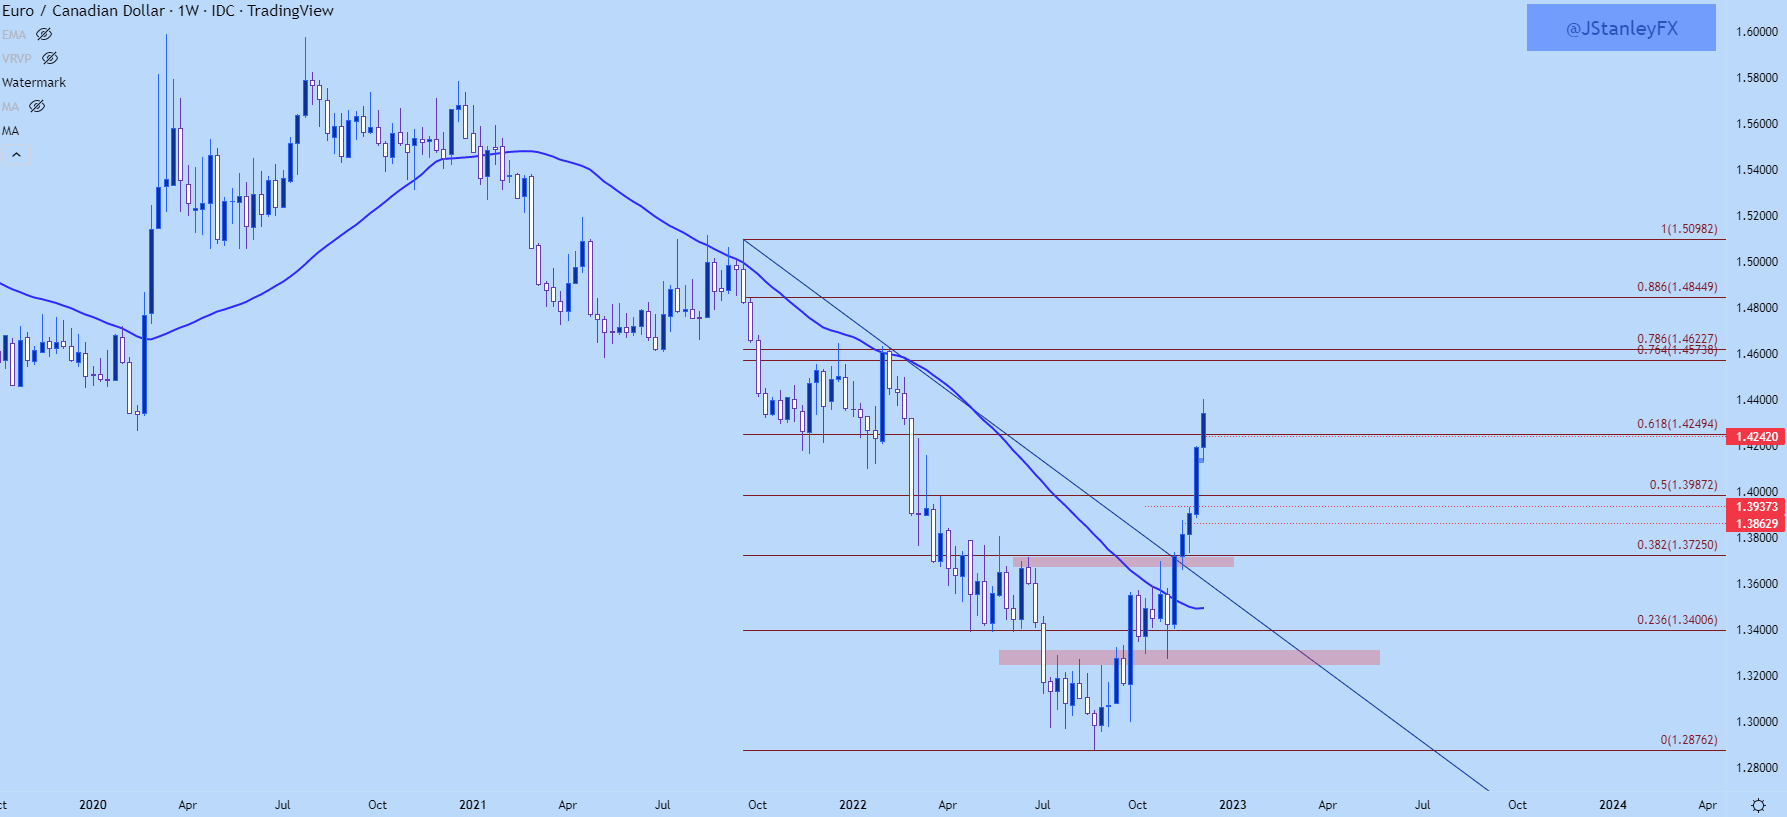
EUR/CAD
EUR/CAD has similarly shown a very one-sided move over the past month. When I looked at the pair in early November it was working with resistance at the 200-day moving average; and after a support test at prior resistance, the door was opening for bullish breakout potential.
A week later, price pushed above the bearish trendline and it’s been off to the races ever since.
EUR/CAD Weekly Chart
(Click on image to enlarge)
The trend has really grown in strength, as well, as noted by the divergence from the recent bullish trendline. This highlights that bulls may want to try to exercise a bit of patience here, with support potential around the 1.4250 psychological level, which is confluent with both a Fibonacci level and a prior swing high and if that can’t hold, there’s another spot of resistance-turned-support plotted around the 1.4125 area.
EUR/CAD Four-Hour Chart
(Click on image to enlarge)
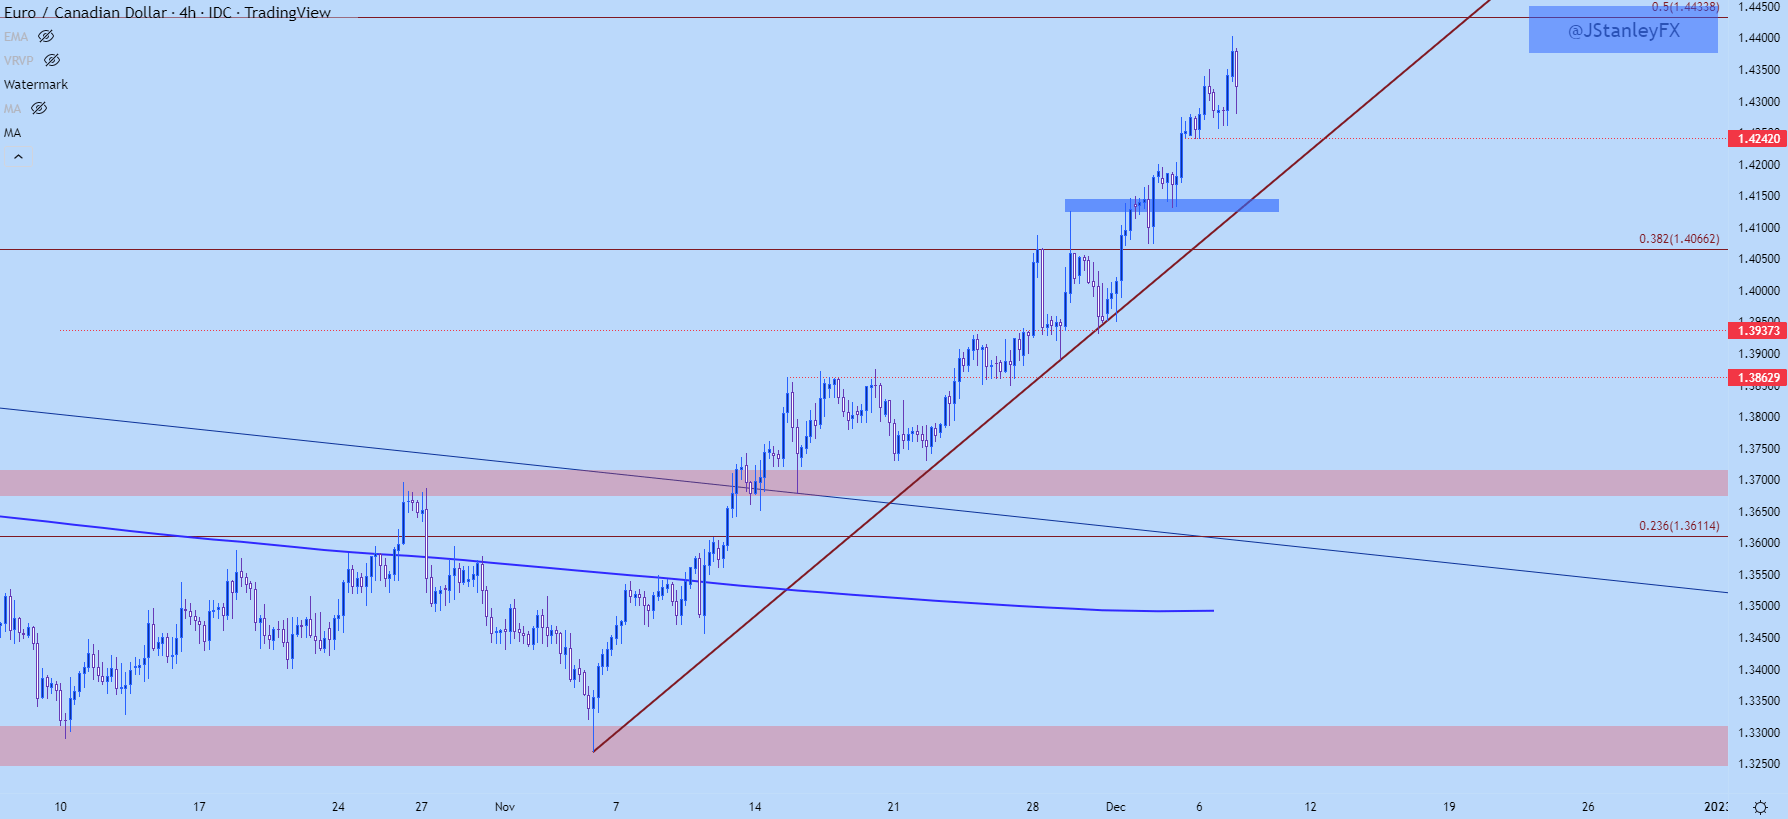
Chart prepared by James Stanley; EURCAD on Tradingview
More By This Author:
S&P 500, Nasdaq, Dow: Key Support Zones Now In Play
Gold, Silver Price Forecast: Gold Snaps Back, Silver Tests Key Support
S&P 500 Technical Analysis: Trendline Resistance, 4k Support Test


Comments
Log in or sign up to join the conversation.