
Canadian Dollar Forecast: USD/CAD Probes For Low Loonie Levels
Canadian Dollar Technical Price Outlook: USD/CAD Weekly Trade Levels
- Canadian Dollar strength is in full view with USD/CAD near six-year-lows.
- USD/CAD oversold on weekly basis and showing RSI divergence on daily basis, may lead to pullback themes towards lower-high resistance.
It was an ideal fundamental backdrop for USD/CAD bears over the past month. While USD/CAD was grinding resistance at a familiar Fibonacci level in late-April, the most recent Bank of Canada rate decision saw the bank take a turn towards post-pandemic policy, and that helped the Canadian Dollar to catch a strong bid that remains in-play today.
On the other side of the pair, the US Dollar remains extremely weak, helped along by last week’s FOMC minutes that highlight a Fed that appears nowhere near taking action, allowing for the potent combination of USD weakness and CAD strength so that the USD/CAD pair could plunge to fresh six-year-lows.
At this point, USD/CAD is holding above the psychological 1.2000 level with a very oversold RSI read from the weekly chart. This makes trend continuation prospects, at least from the current level, a more daunting prospect given just how stretched this move has become.
USD/CAD Weekly Price Chart
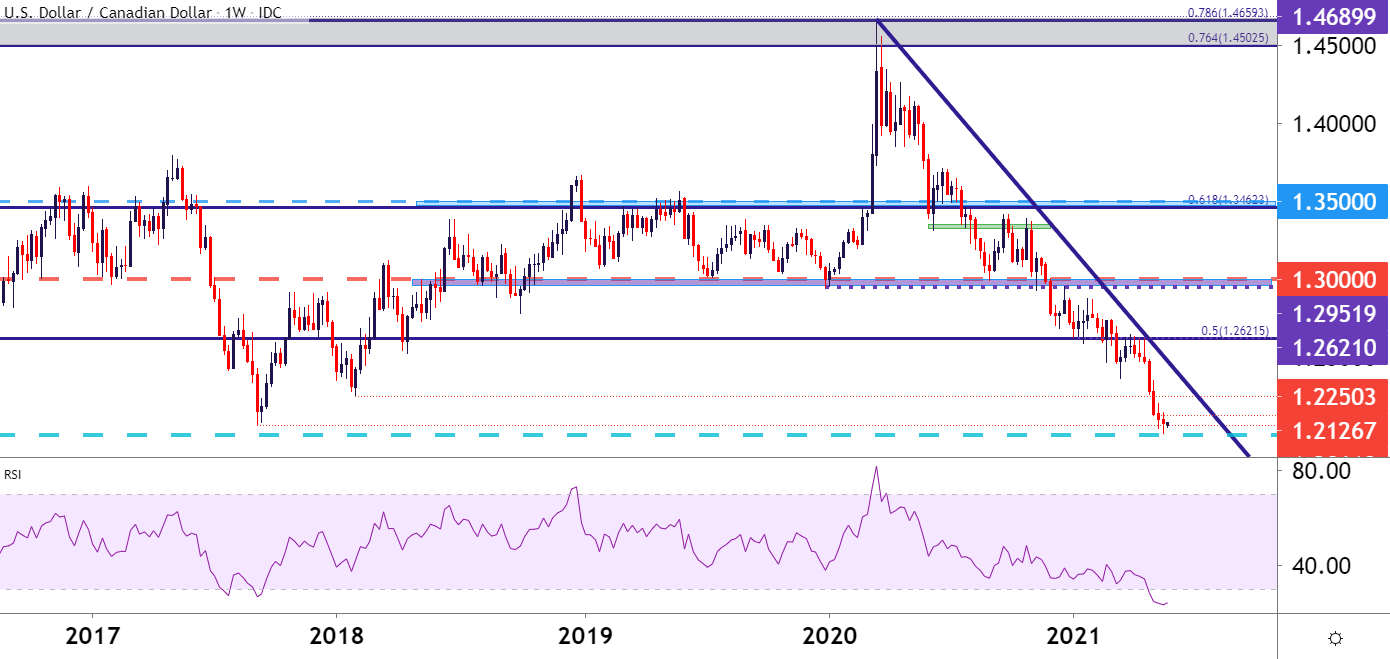
Chart prepared by James Stanley; USDCAD on Tradingview
USD/CAD Pullback Potential
The trend in USD/CAD remains strong and clearly bearish. The bigger issue at this point is one of timing and positioning, as the major pair remains very near a big level that, so far, bears have been unable to overcome.
Joining that oversold RSI reading on the weekly chart above, the same indicator has begun to diverge on the Daily chart, further hinting that a pullback may be nearing after a very aggressive extension of the sell-off that’s now spanned more than a month. This doesn’t necessarily obviate the bearish trend, but it does highlight the fact that sellers may want to be patient here, looking for a pullback that could possibly allow for entry on bearish trend resumption strategies.
USD/CAD Daily Price Chart
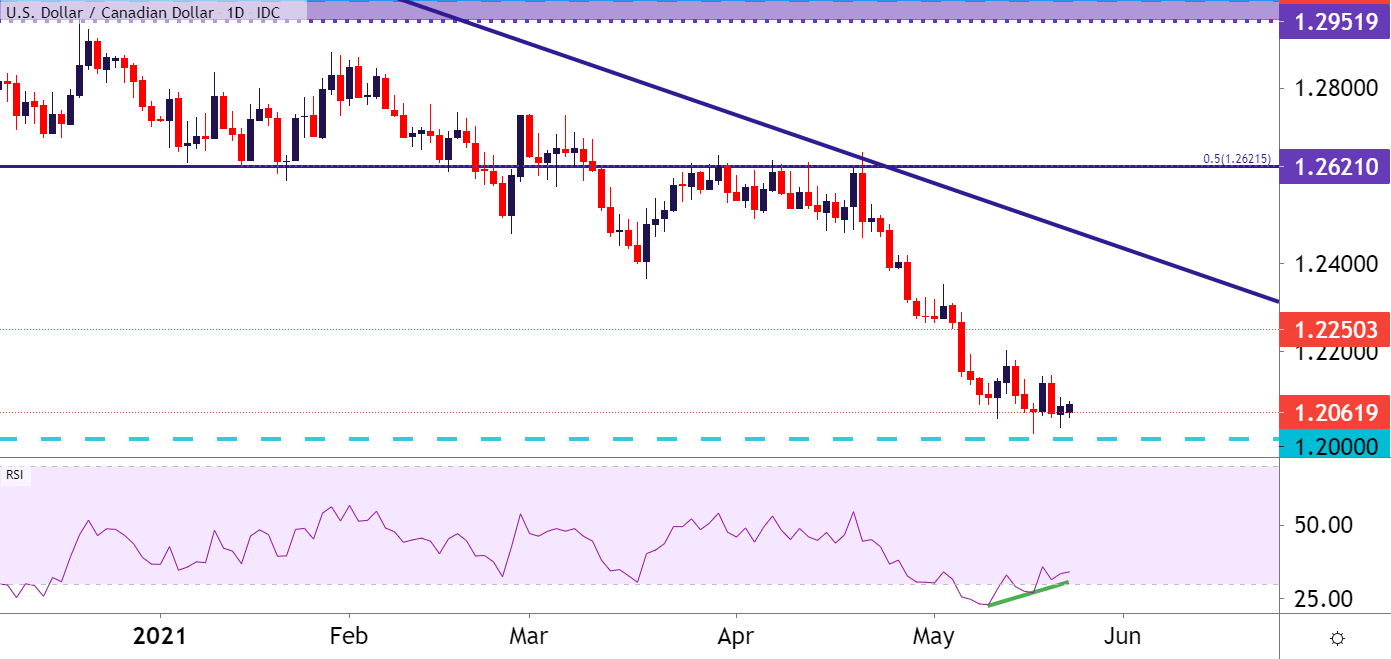
Chart prepared by James Stanley; USDCAD on Tradingview
USD/CAD: Loonie Levels
On the four-hour chart below, I’ve identified a few areas of interest for lower-high resistance in bearish continuation scenarios. The first and closest is from last week’s swing-high, around 1.2143; after which the weekly high from two weeks ago comes into view around 1.2203.
The level around 1.2250 is the 2018 swing-low, and this can function as an ‘r3’ zone of resistance. A breach above that level would entail a 200+ pip retracement from last week’s low. While this could still be a small pullback in the grand scheme of the larger trend, a break above that level should come with a renewed look into the technical backdrop in USD/CAD.
USD/CAD Four-Hour Price Chart
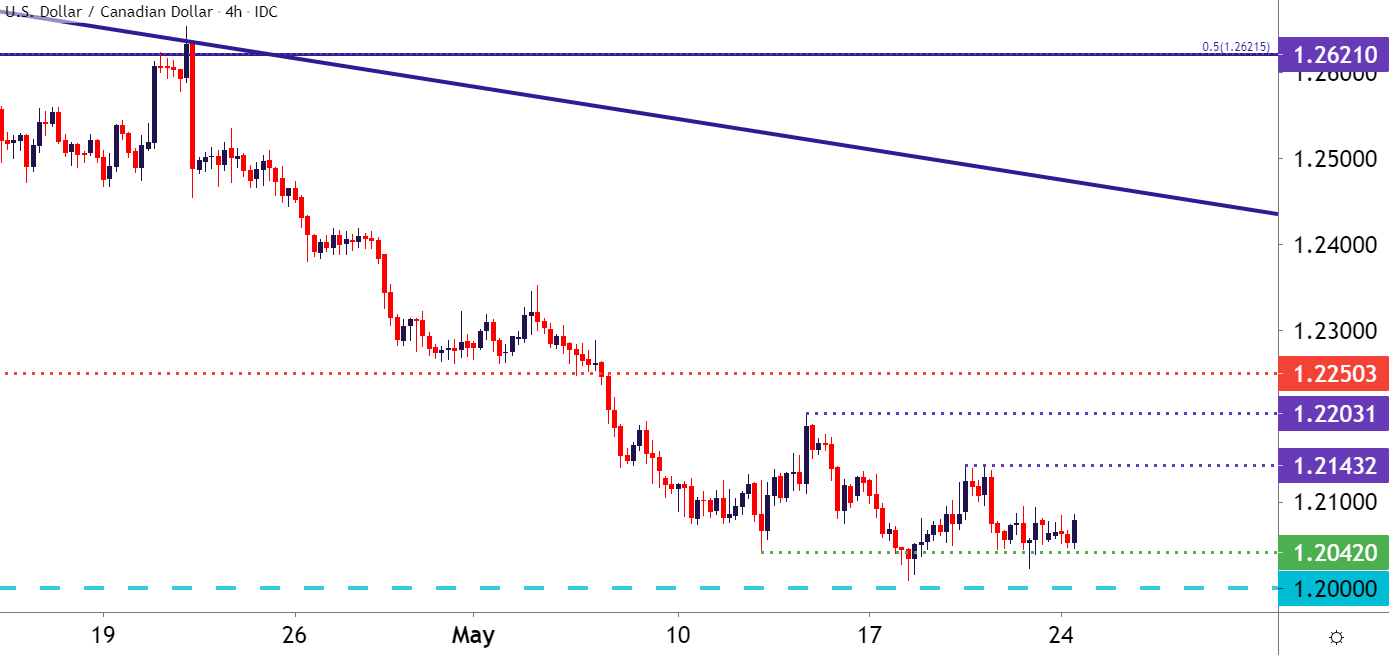
Chart prepared by James Stanley; USDCAD on Tradingview
Disclosure: See the full disclosure for DailyFX here.


