
Canadian Dollar Forecast: USD/CAD Falling Wedge Threatens Reversal

- As looked at in yesterday’s webinar, USD/CAD has built into a falling wedge formation.
- Falling wedges will often be approached with the aim of bullish reversals, and USD/CAD has already jumped up to the first resistance level looked at yesterday.
- The analysis contained in article relies on price action and chart formations. To learn more about price action or chart patterns, or the falling wedge shown in USD/CAD, check out our DailyFX Education section.
It’s been a day of strength for USD/CAD which may come as a surprise given that he currency pair pushed down to a fresh two-year-low earlier this morning. But, as USD-strength has begun to filter in, USD/CAD has rallied up to find a bit of resistance from a prior batch of swing lows.
This resistance was highlighted in yesterday’s webinar, and plots around the 1.2719 area on the chart. This was a batch of support in early-mid December and, so far this morning, sellers have been able to defend this line in the sand following the pair’s bullish burst.
USD/CAD TWO-HOUR PRICE CHART
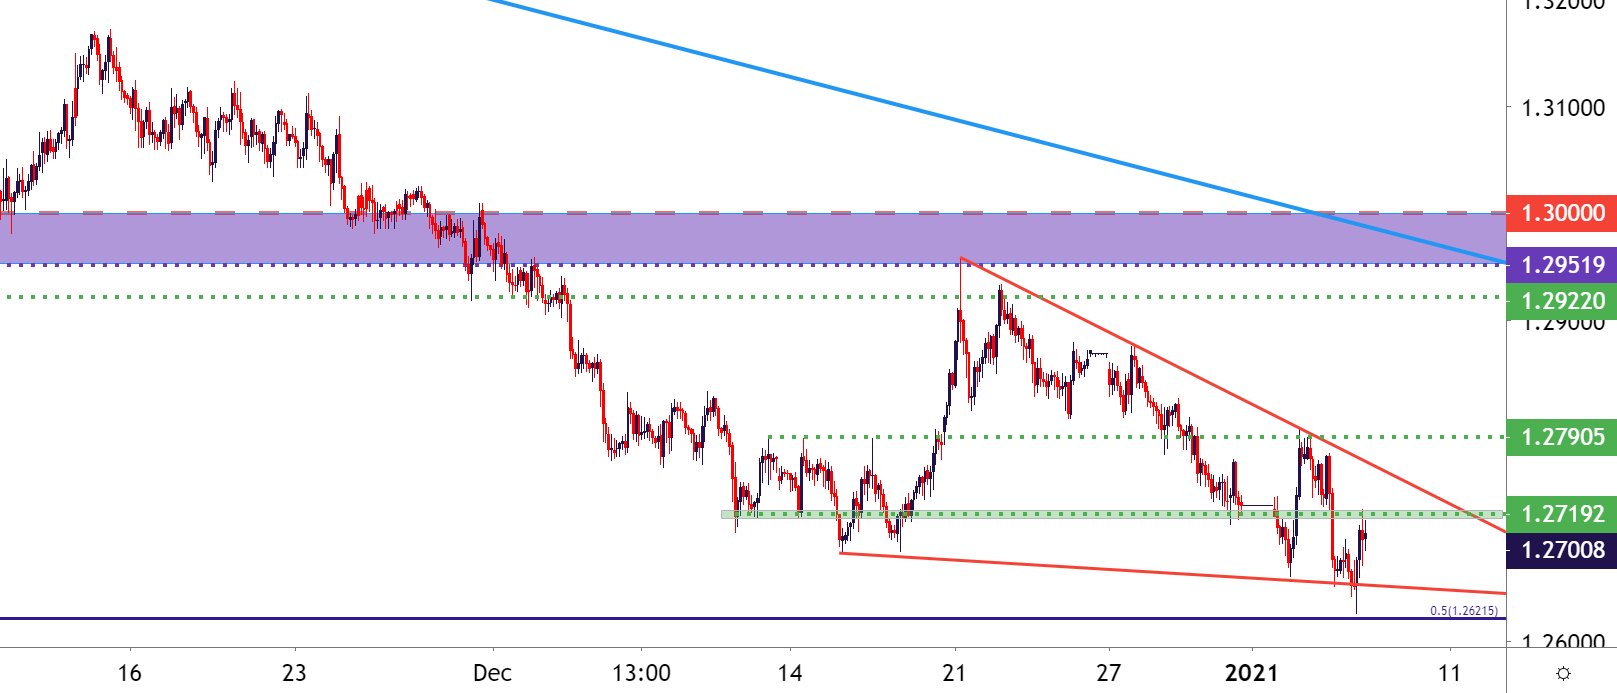
Chart prepared by James Stanley; USDCAD on Tradingview
USD/CAD BUILDS FALLING WEDGE – CAN BUYERS BRING REVERSAL?
Also highlighted in yesterday’s webinar is the slightly bigger picture context in the pair; in which the build of a falling wedge formation threatens the possibility of a pullback. As both USD and USD/CAD have been showing varying oversold conditions, the appearance of this formation highlights the fact that sellers may be preparing to take a back seat, at least temporarily.
Falling wedges are often approached with the aim of bullish reversals; and the levels looked at yesterday were 1.2719 (already in play), 1.2791 (the Monday swing high) followed by 1.2922 (the November swing-low).
To learn more about falling wedge patterns and how traders can incorporate them into their strategies, join us in DailyFX Education
Beyond that, a big level of prior interest comes back into the equation and that runs from 1.2952-1.3000. This is the zone that had helped to set support around last year’s open; and this area came back into play a few weeks ago when USD/CAD prices spiked up to lower-high resistance.
USD/CAD FOUR-HOUR PRICE CHART
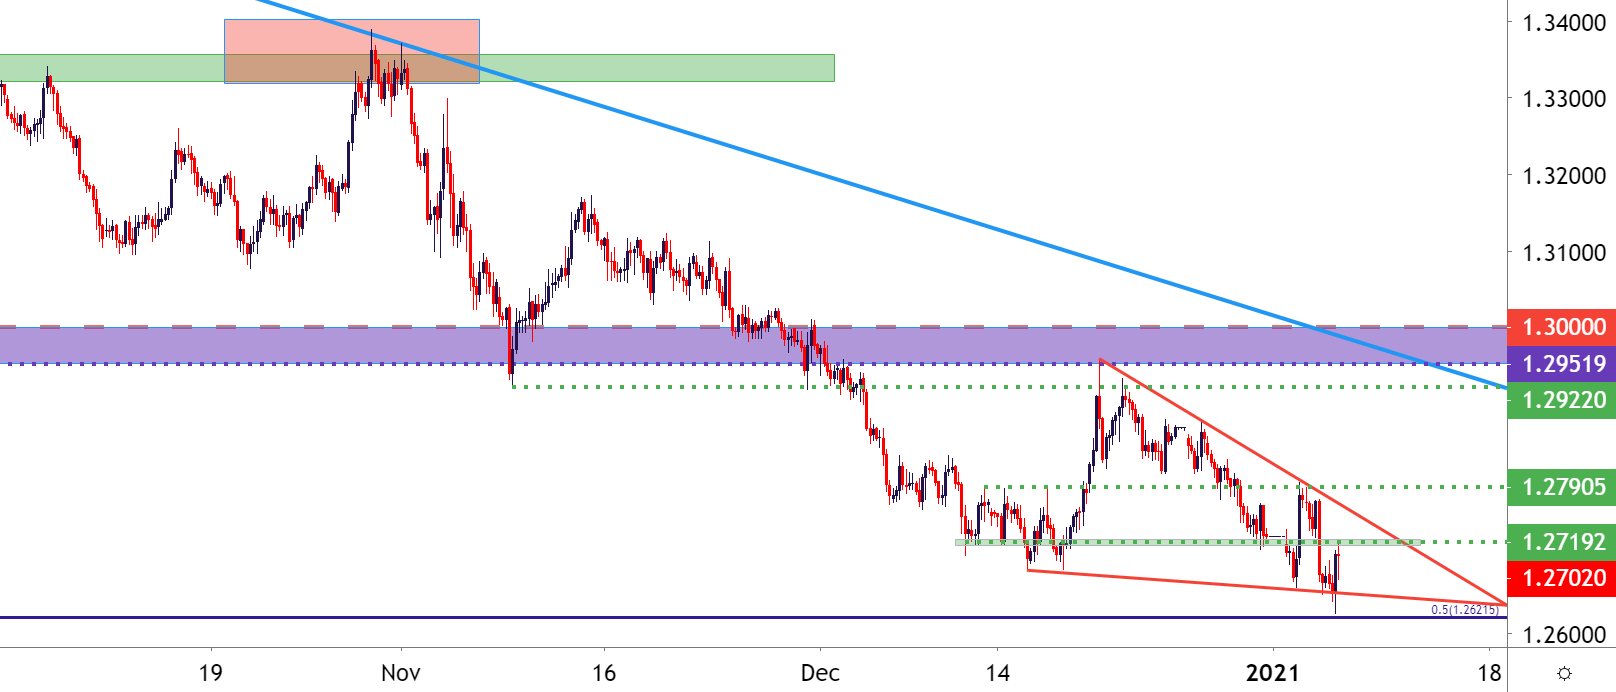
Chart prepared by James Stanley; USDCAD on Tradingview
USD/CAD LONGER-TERM: CAN A PULLBACK BECOME ANYTHING MORE?
Most reversals start as a simple pullback. The question as to whether or not that turns into a full-fledged reversal is going to remain, and in USD/CAD, that can be a difficult projection to get behind at the moment.
From the Daily chart below, we can see where bears have had control of the matter since March of last year. Along the way, the pair has fallen by as much as 13.9%. It also makes for a fairly clear picture of just how bearish matters have been in the pair and, at this stage, forecasting both short-term bearish trends and longer-term bearish trends to reverse seems like a bit of a stretch.
What could make that look more attractive is a topside breach and a re-claim of support back-above the 1.3000 handle. But, until then, traders may want to approach bullish pushes in USD/CAD as corrective in the longer-term picture of USD/CAD weakness.
USD/CAD DAILY PRICE CHART
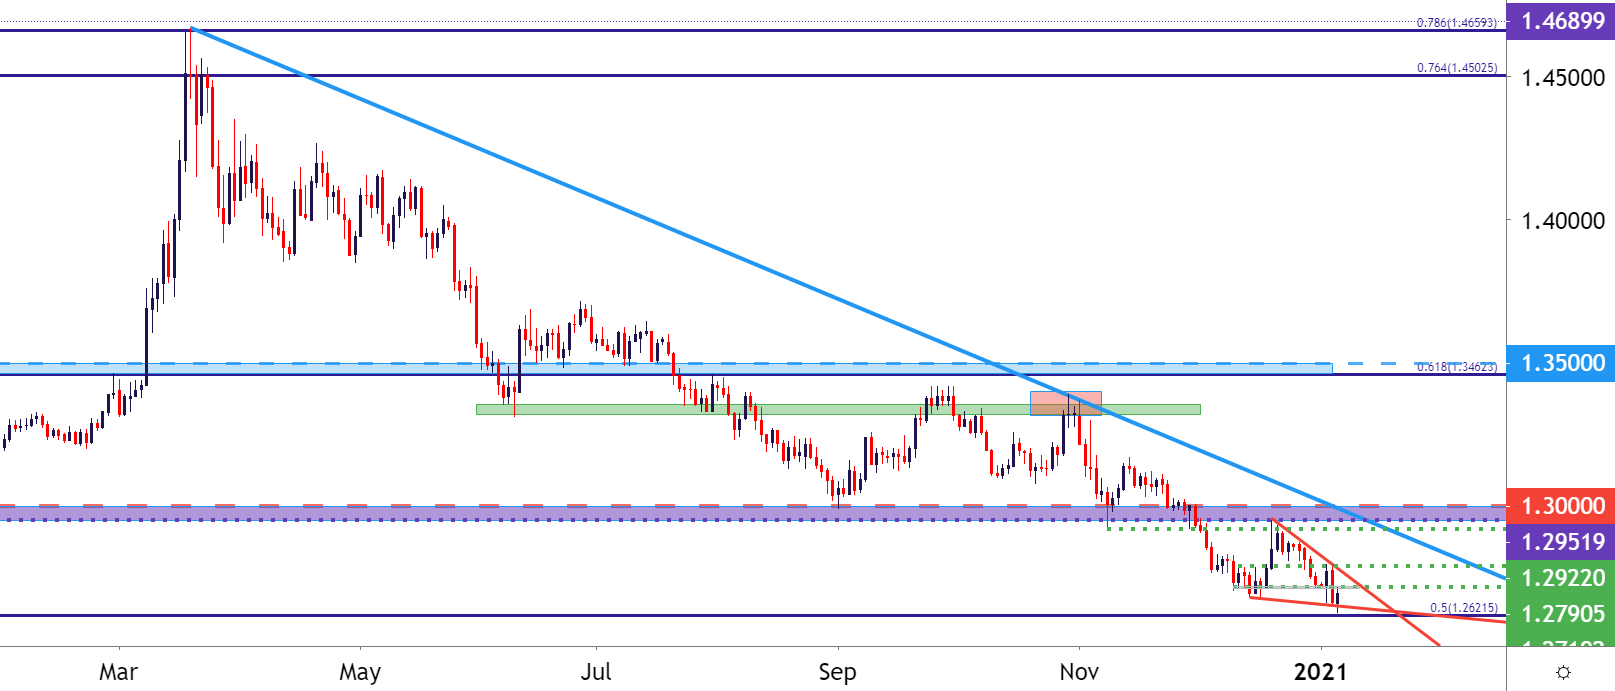
Chart prepared by James Stanley; USDCAD on Tradingview
Disclosure: See the full disclosure for DailyFX here.


