
Canadian Dollar Forecast: BoC Tapering Bets To Buoy CAD Against JPY, USD, EUR
Canadian Dollar, USD/CAD, CAD/JPY, EUR/CAD, Bank of Canada – Talking Points:
- Equity markets traded mixed during APAC trade as Treasury yields hovered at yearly highs.
- Robust economic data may intensify Bank of Canada tapering bets and open the door for CAD to continue gaining ground against EUR, USD and JPY.

Asia-Pacific Recap
Equity markets traded mixed during Asia-Pacific trade, as long-term Treasury yields held steady at the highest levels since February 2020 ahead of the upcoming FOMC monetary policy meeting. Australia’s ASX 200 nudged 0.09% higher and the Nikkei 225 climbed 0.17%, while Hong Kong’s Hang Seng Index drifted 0.19% lower.
China’s CSI 300 plunged 2.73% on mixed economic data and policy tightening concerns. In FX markets, the cyclically-sensitive New Zealand Dollar and Canadian Dollar climbed higher alongside the haven-associated US Dollar and Swiss Franc. Gold drifted lower, while silver traded unchanged, as yields on US 10-year Treasuries climbed 1-basis point higher (UUP, FXF, GLD,SLV, SPTL).
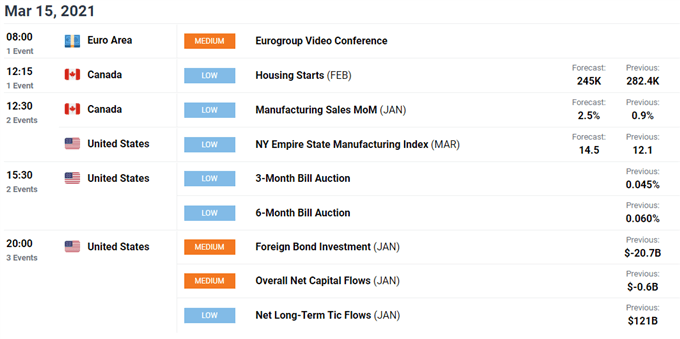
Looking ahead, US net capital flow and foreign bond investment figures for January headline a rather light economic docket.
Bank of Canada Tapering Bets to Underpin CAD
The Canadian Dollar (FXC) surged higher against the lower-beta US Dollar, Japanese Yen (FXY) and Euro (FXE) at the tail-end of last week, as market participants begin to bet on the Bank of Canada tapering its Quantitative Easing measures at its monetary policy meeting in April, in response to extremely strong jobs data.
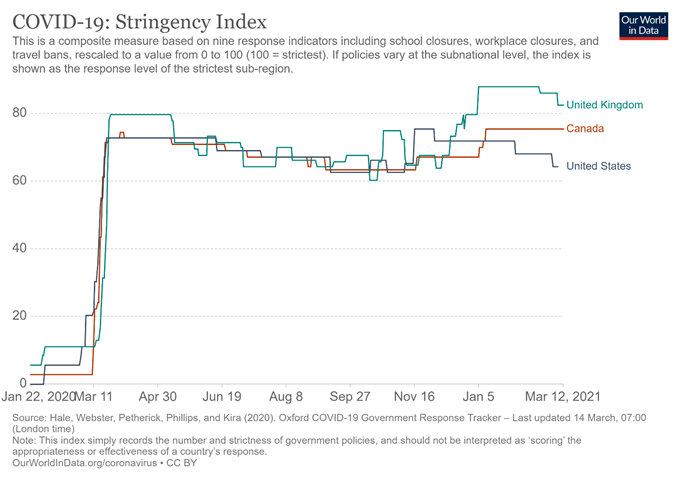
The nation’s unemployment rate fell 1.2% to 8.2% in February, drastically exceeding consensus estimates, while the participation rate held firm at 64.7%. This overwhelming drop in joblessness comes in spite of the majority of the country still operating under the tightest restrictions seen since the inception of the pandemic, according to the Oxford COVID-19 Government Response Tracker.
The vaccine rollout has also been relatively cumbersome, with only 6.2% of the population receiving at least one dose of a coronavirus vaccine. This is sharply lower than the levels seen in the United States (20.6%) and United Kingdom (34.9%).
Therefore, it seems reasonable to expect the local economic recovery to pick up rapidly as the vaccination rate increases. Moreover, with BoC Deputy Governor Lawrence Schembri stating that the central bank “now expect that inflation will move temporarily above our 2% target in the coming months, to around the top of the 1 to 3% control range”, tapering QE measures could be a distinct possibility.
Especially when considering that the central bank has already reduced its total bond purchases from $5 billion to $4 billion a week, and Governor Tiff Macklem’s prior warnings that “as much as bold policy response is needed, it will inevitably make the economy and financial system more vulnerable to economic shocks down the road”.
With that in mind, the Loonie could be poised to continue outperforming its lower-beta counterparts over the longer-term.
USD/CAD Daily Chart – Short-Term Pullback in the Cards?
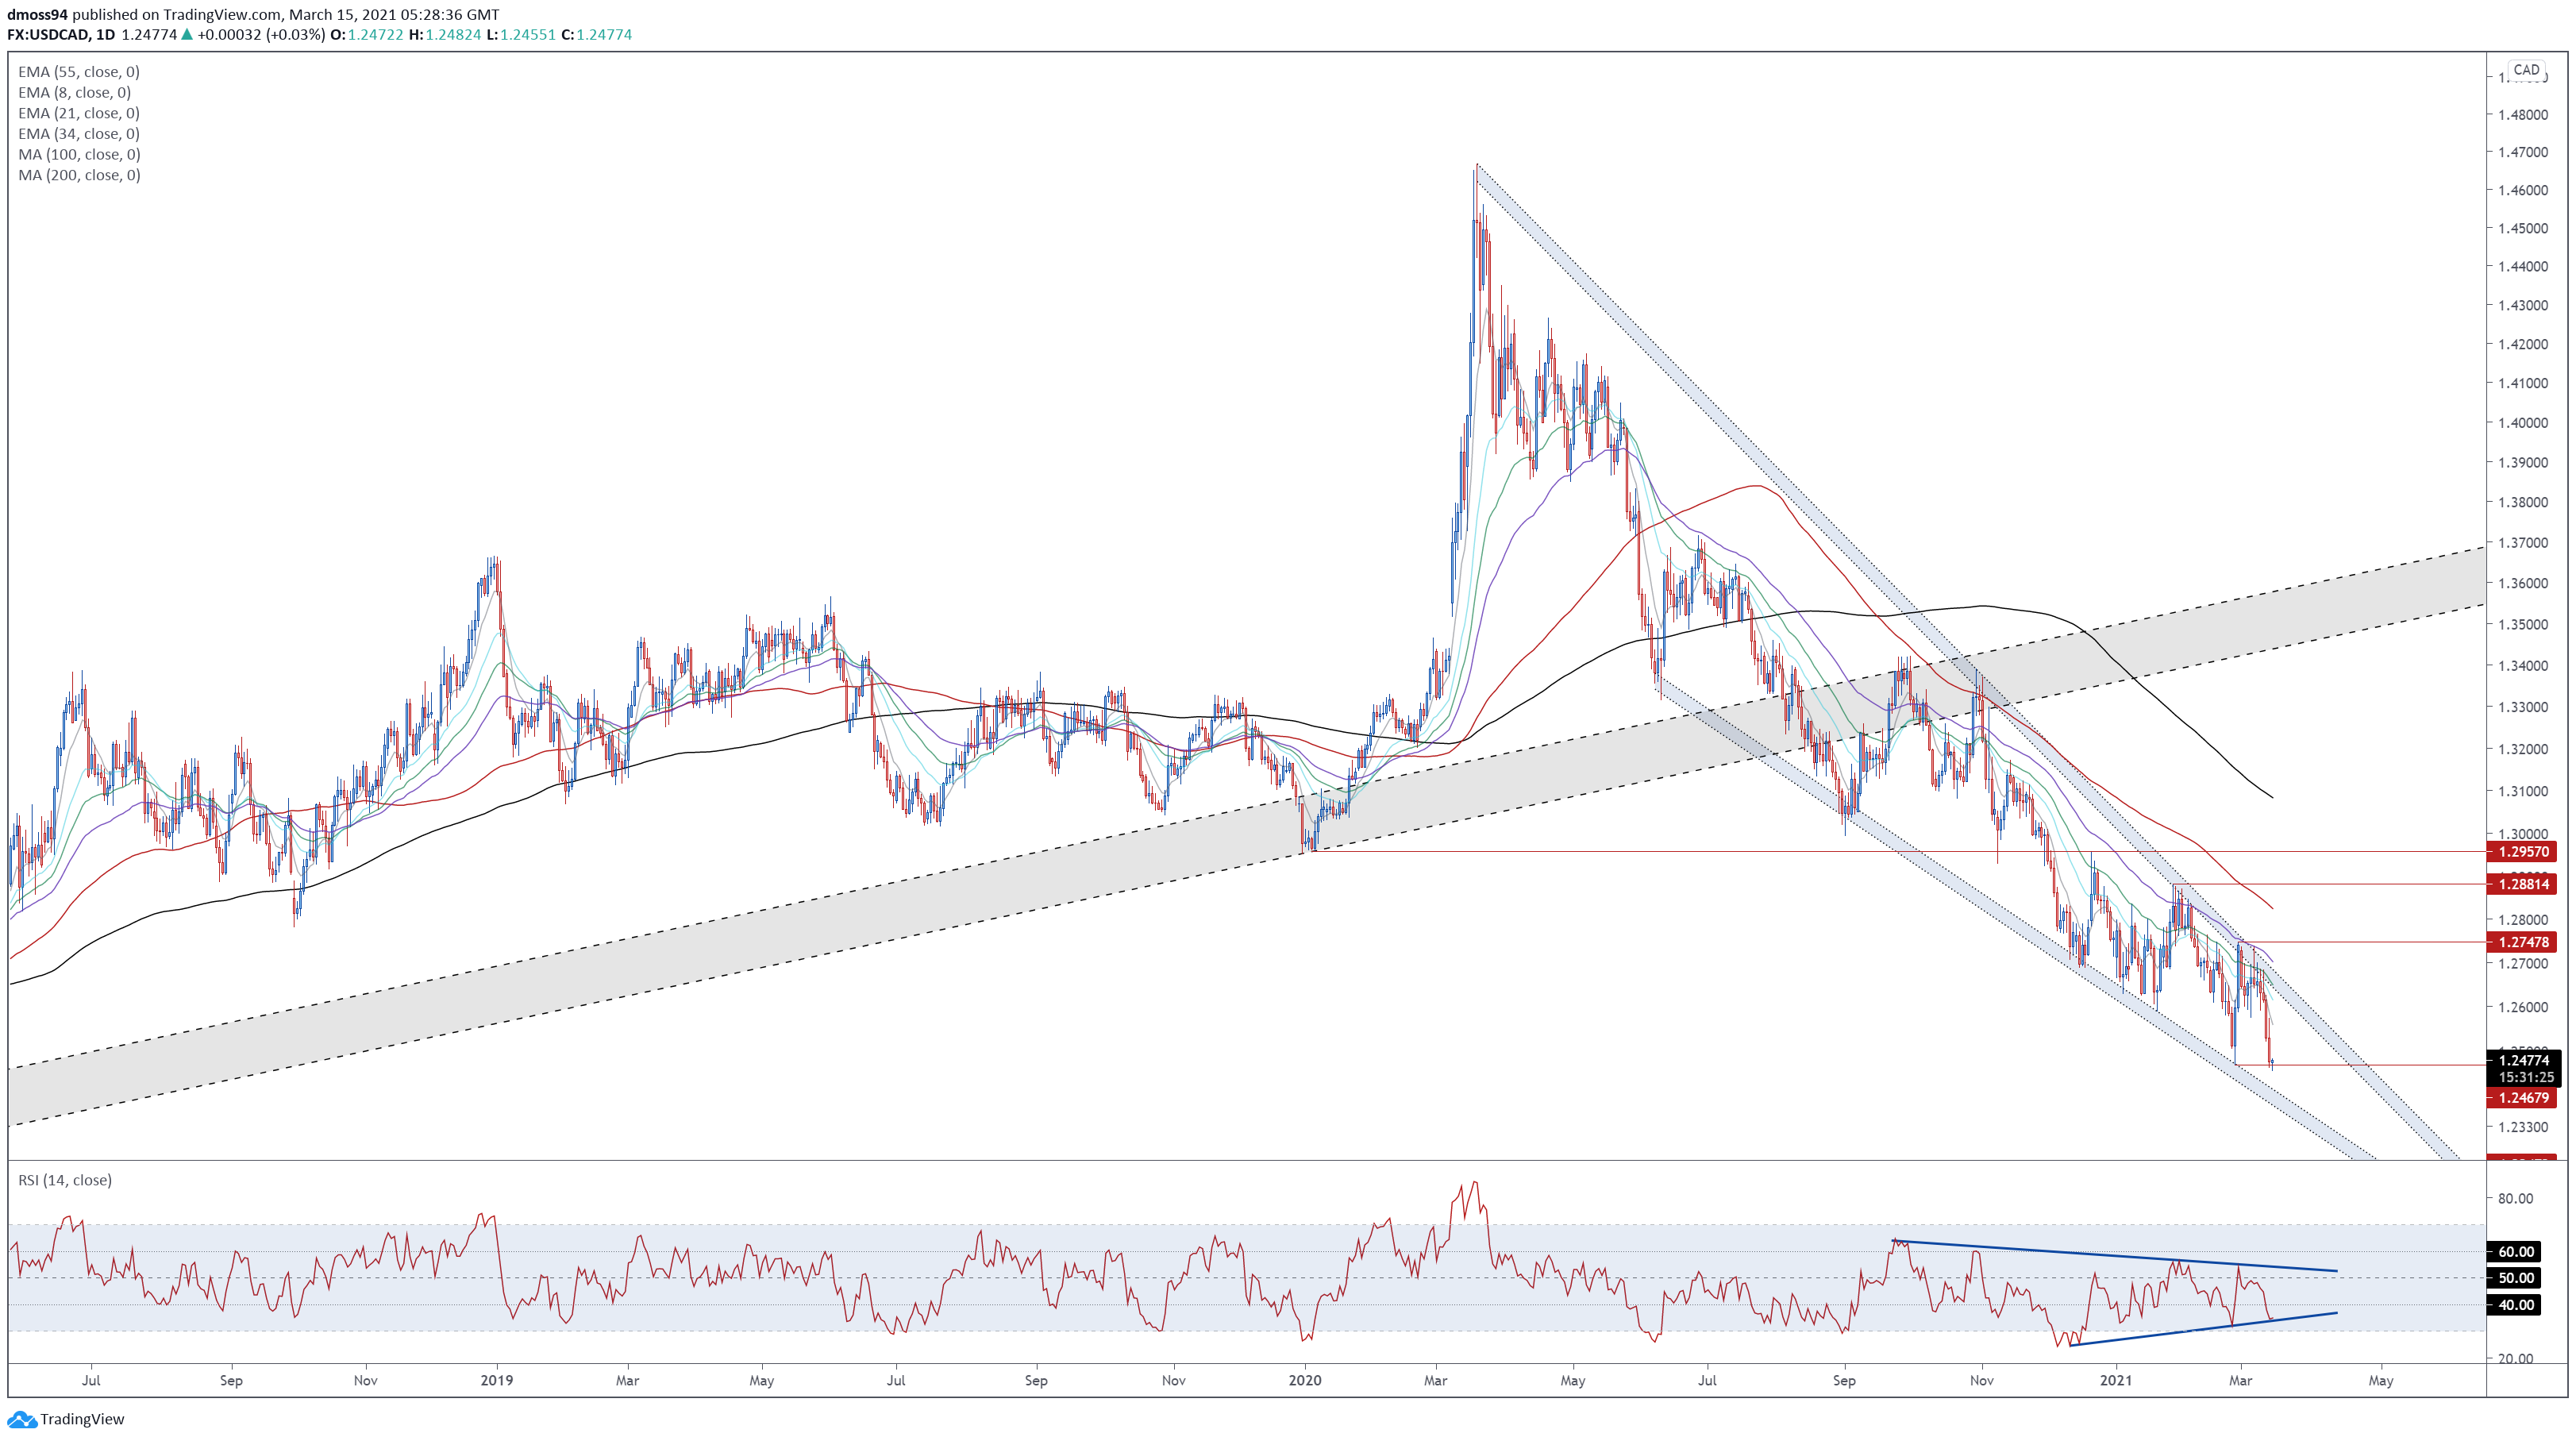
USD/CAD daily chart created using Tradingview
Although the longer-term technical outlook for USD/CAD rates remains skewed to the downside, significant bullish RSI divergence suggests the recent push to fresh yearly lows may be running out of steam.
There’s also a possibility that price is carving out a bullish Rising Wedge pattern however, a significant break above the 1.2700 handle would probably be required to validate that.
Nevertheless, a near-term push to challenge former support-turned-resistance at 1.2600 looks likely, with failure to break above this providing an opportunity for sellers to initiate new short positions with a relatively rewarding risk-to-reward ratio.
Ultimately, a daily close below 1.2460 is needed to signal the resumption of the primary downtrend and bring the 2018 low (1.2247) into play.
CAD/JPY Daily Chart – Exponential Surge Eyeing Triangle Measured Move
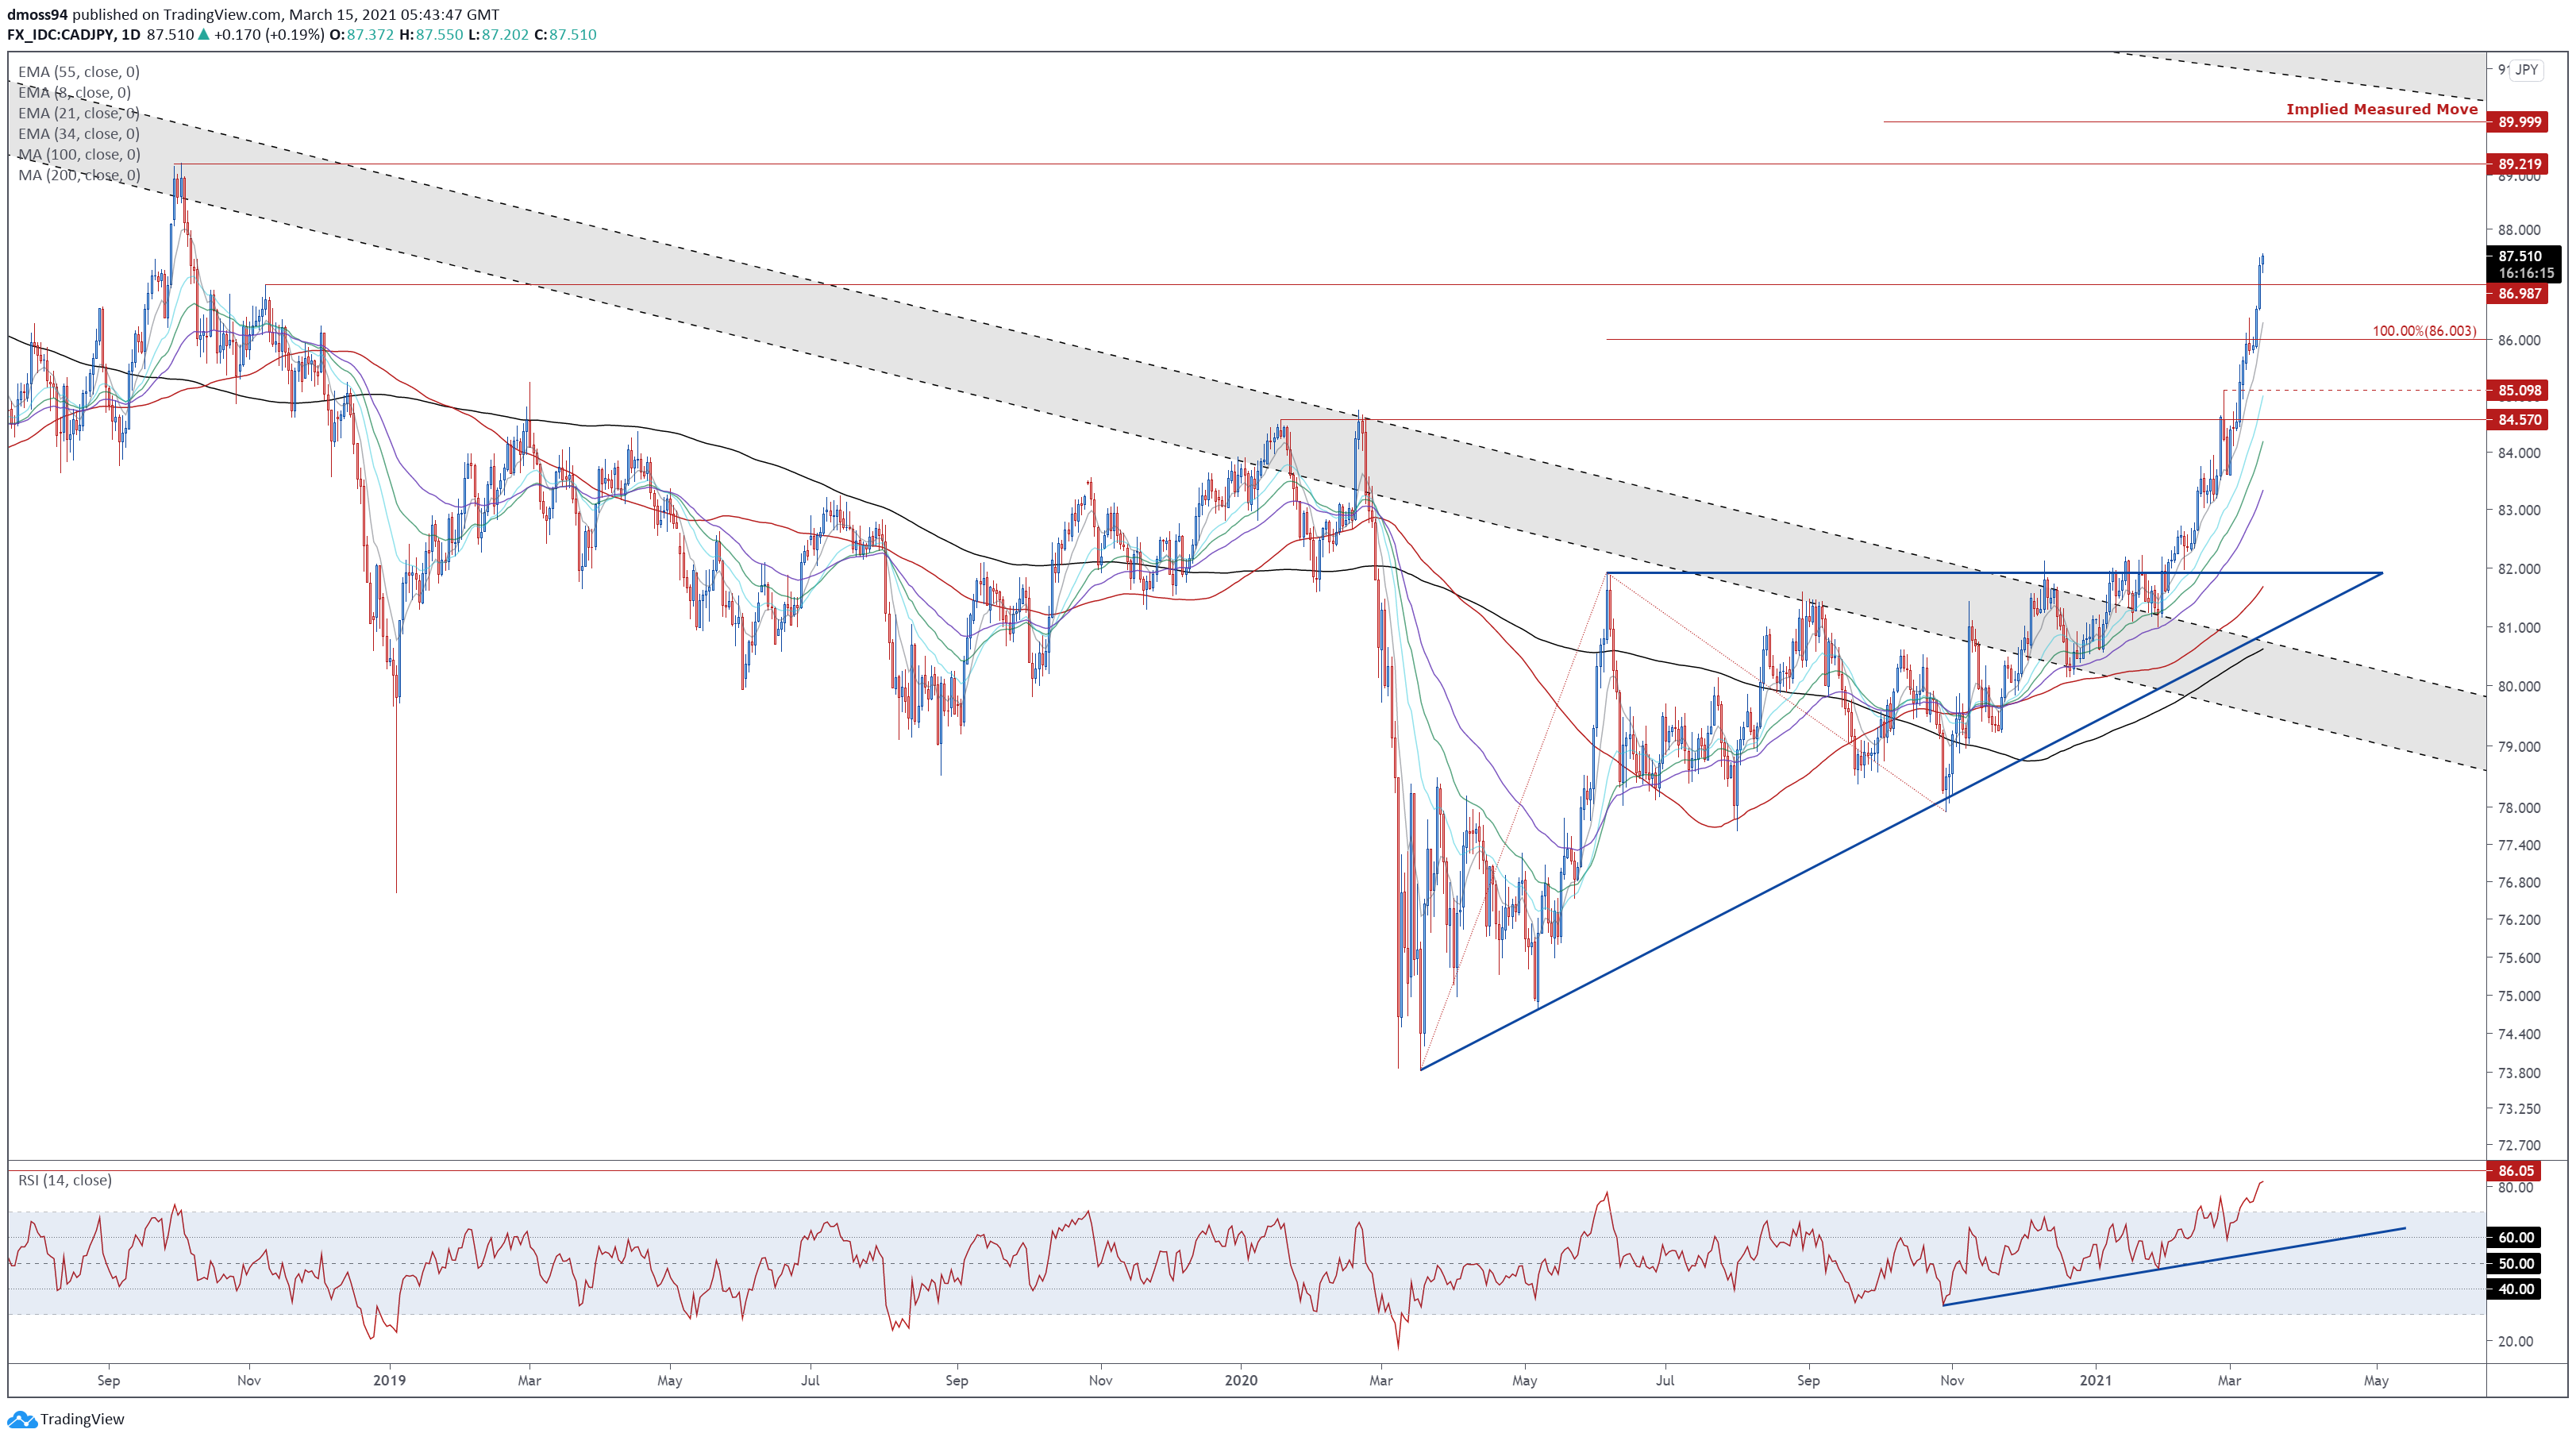
CAD/JPY daily chart created using Tradingview
CAD/JPY rates have exploded higher since breaching Ascending Triangle resistance at the beginning of February, surging just under 8% YTD to its highest levels since October 2018.
With the RSI climbing to its most extreme levels since late 2016, and the slopes off all six moving averages markedly steepening, the path of least resistance seems higher.
That being said, the sheer pace of the move higher could leave the exchange rate at risk of a technical pullback.
If psychological resistance at 88.00 holds firm, a counter-trend correction back towards the March 9 high (86.38) and 100% Fibonacci (86.00) could be on the cards. Clearing that carves a path for price to challenge the February high (85.10).
However, an extended pullback seems relatively unlikely, with the Ascending Triangle’s implied measured move suggesting that the exchange rate could extend its climb to challenge the psychologically-imposing 90 mark.
EUR/CAD Daily Chart – Double Top Neckline Break Hints at Further Losses

EUR/CAD daily chart created using Tradingview
EUR/CAD rates have collapsed since the start of the month, and look set to extend recent declines as price slices easily through the neckline of a Double Top pattern carved out back in August of 2020.
With price tracking firmly below all six moving averages, and the RSI entering oversold territory for the first time since February 2020, the path of least resistance continues to favour the downside.
A daily close below range support at 1.4870 – 1.4895 would probably intensify selling pressure and carve a path for price to test supportive confluence at the 78.6% Fibonacci (1.4631) and uptrend extending from the 2021 lows.
Alternatively, if range support holds firm, a counter-trend relief rally back towards the March 9 low (1.4986) may be in the offing.
Disclosure: See the full disclosure for DailyFX here.


